Customizing the Map Display
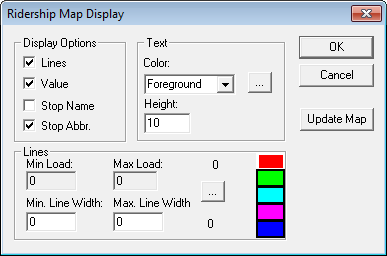
Customize the settings for colors, line widths, and the appearance of the nodes on the map in the Ridership Map Display dialog box.
Note: The path is a direct line between each node and not necessarily the actual path of the
route. No path appears between the nodes for trips that have not yet been checked.
The
line connecting the nodes represents the path the vehicle travels along a trip. This line
varies in color and width to indicate where the maximum and minimum load, board, or alight
values have been recorded for a trip. The thickest part of the line represents the location on
the trip with the maximum load (the highest number of passengers aboard the vehicle at one
time), number of boardings, or alightings.-
Click .
The Ridership Map Display dialog box appears.