Demographic Analysis Options
The following table describes the fields on the Demographic tab in the PLAN Options dialog box.
| Options | Description |
|---|---|
|
Demographic Datasource |
Displays the name of the FX database that you defined in System properties. |
| Table |
Lists all the tables that are available in your census data source, including the
demographic tables containing the attribute data that is related to the Polygon
Layer (for example, census geography and traffic analysis zones).
Note: If you do not
see the table that you want, contact your Trapeze representative. |
| Polygon Matching Field |
Sets the field name of the unique identifier or ID of the record in the demographic database that is equivalent to the related ID of the map polygon data.
|
| Display Field |
Lists the fields that are available in the table that you selected. Field names that appear in red include a Demand Forecast index definition. |
|
Polygon Layer |
Shows the list of polygons that were defined when the map was built. They include administrative polygons such as counties and ADA polygons. The polygon layers that are important to demographic analysis are block, blockgroup, TAZ (traffic analysis zone), and census tract. Users may also define their own polygon layers.Note: If you do not see the required polygon layer in your list,
contact your Trapeze representative. |
|
Import Polygon Shapefile |
Allows users who have ESRI MapObject runtimes installed to import census data-based polygons. This button is not available if you do not have the required runtimes. If you require more information about importing polygon shapefiles, contact your Trapeze representative. |
|
Display Values |
Shows the numeric value of each polygon on the map. |
| Display Label | Shows the name of each polygon on the map. |
|
Demand Forecast Def |
Opens the Demand Forecast Index Definition dialog box. This button does not become available until the data source is selected in the Demographic Datasource field. |
|
Ranges |
Opens the Data Ranges dialog box, which allows you to examine
the maximum and minimum values, the range of values for each type of polygon, and
the total number of polygons within the buffer.
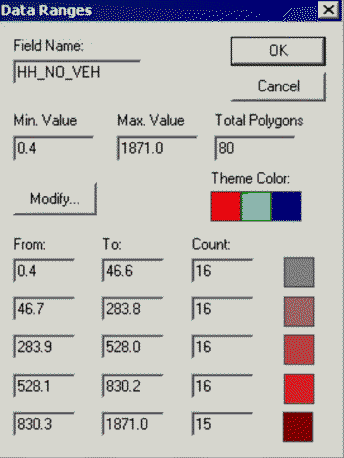
|