Place text in quotation marks for exact match search results.
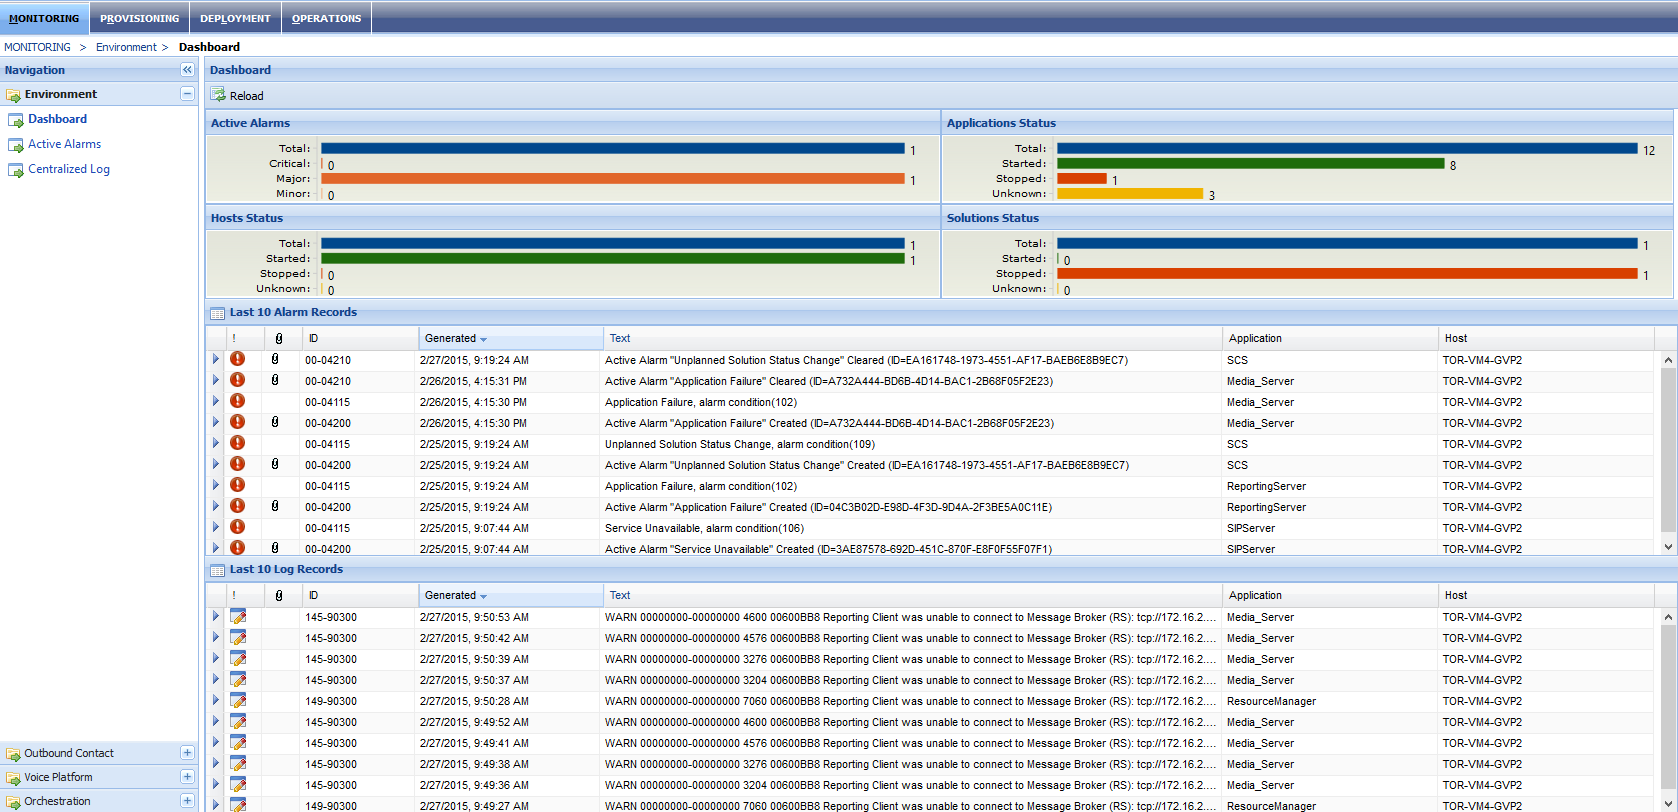
Call Dashboard
This screen gives you an overview of the health of the system, automatically appearing
after you successfully log in.
The screen is divided into various panes and grids.
Table 1. Call Dashboard Panes
Pane
Description
Elements
Navigation Pane
Left pane which provides links to the different components under each of the
following tabs.
Monitoring
Provisioning
Deployment
Operations
Status Pane
Four panes on the upper section of the right pane.
Active Alarms
Application Status
Hosts Status
Solutions Status
Records grids
Two grids in the lower section of the screen show logs regarding the inbound
and outbound calls. The number of records shown in each grid can be configured.
The example shows the last ten records for each type.
Alarm records
Log records
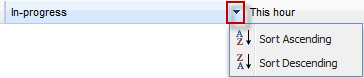
Sorting Records
To sort the data in the grids by column, click the arrow on the right of the
column header, and then select the desired sort order option: Sort Ascending or
Sort Descending.
The up arrow sorts data in ascending order.
The downward arrow sorts the data in descending order.
Alternatively, click the arrow beside the column header.
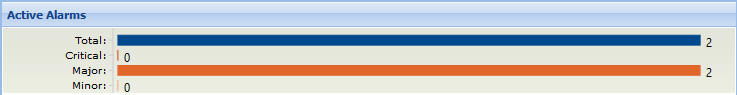
Alarm Codes
The color of the bars in the Active Alarms panes indicates whether there are
alarms and if any, to what degree: Critical, Major, or Minor.
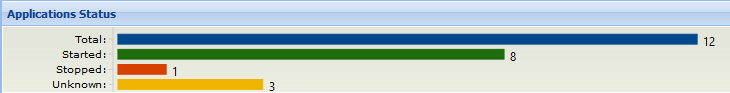
Status colors
The following graphic shows an example of the Applications Status pane. The
colors of the bars also apply to the Host Status and Solutions Status
panes.
Online (green bar), Components that are running without any reported
issues.
Stopped (red bar), Indicates the component is offline.
Unknown/Initializing (yellow bar) component is in a transient state
(currently being stopped or started).