Ridership Analysis Screen
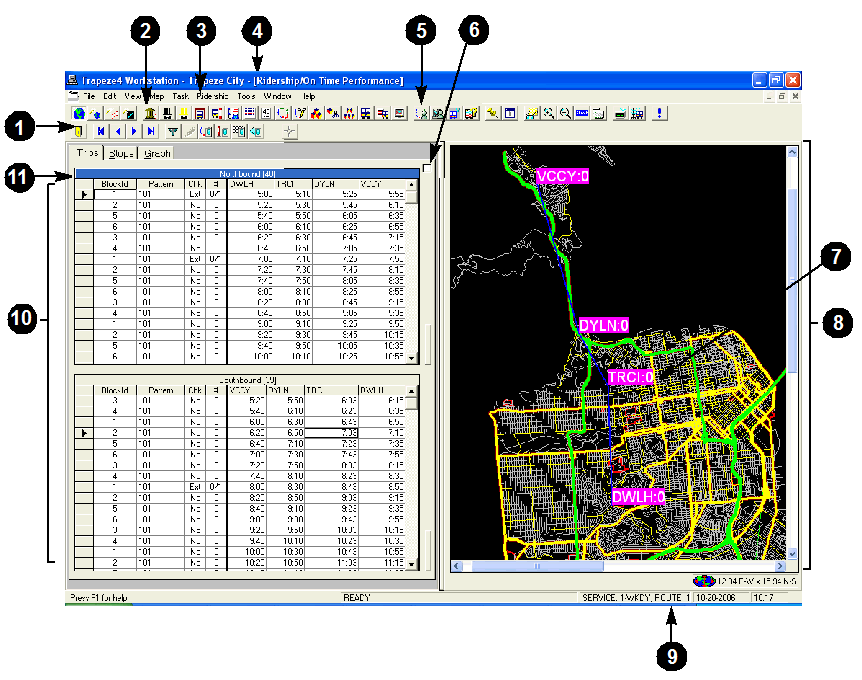
The following graphic shows the Ridership Analysis screen with some sample data.
| Parts of the screen | Description |
|---|---|
| 1. Screen toolbar |
The buttons that are available on this toolbar change depending on which task is active. In this case, the commands applied in the Ridership Analysis screen are shown on the toolbar. This toolbar is usually located below the main toolbar. The controls that are available for Ridership Analysis are described in the tables at the end of this section. If you forget what a button represents, point to the button. A tooltip, which shows the Name of the button, appears. |
| 2. Main toolbar | Provides quick access to many of the applications in the Trapeze4 workstation. It also includes buttons for opening the map and changing the map view. |
| 3. Menu bar | This is the main menu. It contains the following headings: File, Edit, View, Map, Task, Tools, Window, and Help. A new heading appears between Task and Tools each time you open a new screen. In the example, Ridership appears between the two items. |
| 4. Application title bar | Displays the name of the application that is currently shown on the screen, the selected database, and the active task. |
| 5. Ridership Analysis button | Launches Ridership Analysis. |
| 6. Show All Stops |
If selected, all stops for the trip are displayed on the grid and on the map. If clear, only the nodes are displayed. |
| 7. Nodes | These are highlighted on the system map with the abbreviated name of the node and load (the number of passengers on board at that specific node). You can change it to display the board, alight, time difference, or dwell time values. |
| 8. System Map |
Displays a view of the entire service area including stop points, routes and zones. When you click the map, the name of the street or intersection where you clicked appears on the left side of the map. |
| 9. Status bar | Identifies what is currently displayed on the map. For example, Service:1-WKDY |
| 10. Ridership Analysis tabs |
The screen has three tabs: Trips, Stops, and Graph. The graphic shows the Trips tab with trips in the ride check mode. The tab is divided into two grids, which show the trips for both directions. In this example, the top grid displays eastbound trips for the selected line and the bottom grid displays the westbound trips. |
| 11. Line direction view bar | Displays the direction and the number of trips for each direction. |