Place text in quotation marks for exact match search results.
About Viewing Location Analysis Results
After running an analysis, you can view the results in the Spatial
Analysis screen.
Summary Tab
The Summary tab displays the following information:
The name of the buffers, if any, including their corresponding buffer type and
area.
The location analysis that you performed displayed as an SQL query.
The total number of records that were retrieved (that is, the total number of items
that met your criteria). The number of records that actually fell into the spatial
filter that you specified, if any, and the percentage of the total number of
records.
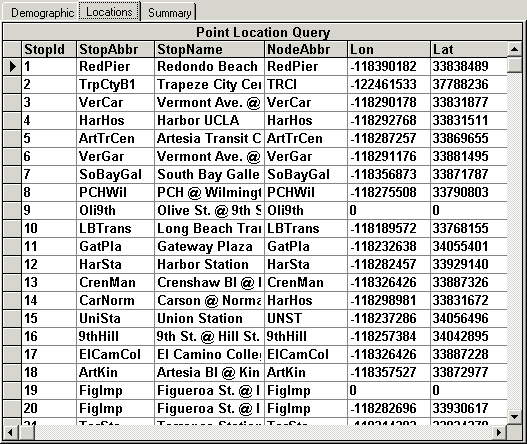
Locations Tab
The Locations tab displays the records that were retrieved and each
field that you selected on either:
The Location tab of the PLAN Options dialog
box for a Location Analysis.
The SQL select statement for a Point Location Query.When the results are also displayed as corresponding points on the map, you can
select the row marker of a point on the Locations tab to highlight
the corresponding point on the map. You can customize how the selected point appears on
the map. The following graphic shows a blue square representing the selected point while
the white circle with a red outline stands for a location point.
Tip: If the results do not appear on the
Locations tab, select the Summary tab,
and then switch back to the Locations tab.
 Tip: If the results do not appear on the Locations tab, select the Summary tab, and then switch back to the Locations tab.