Using Dashboards
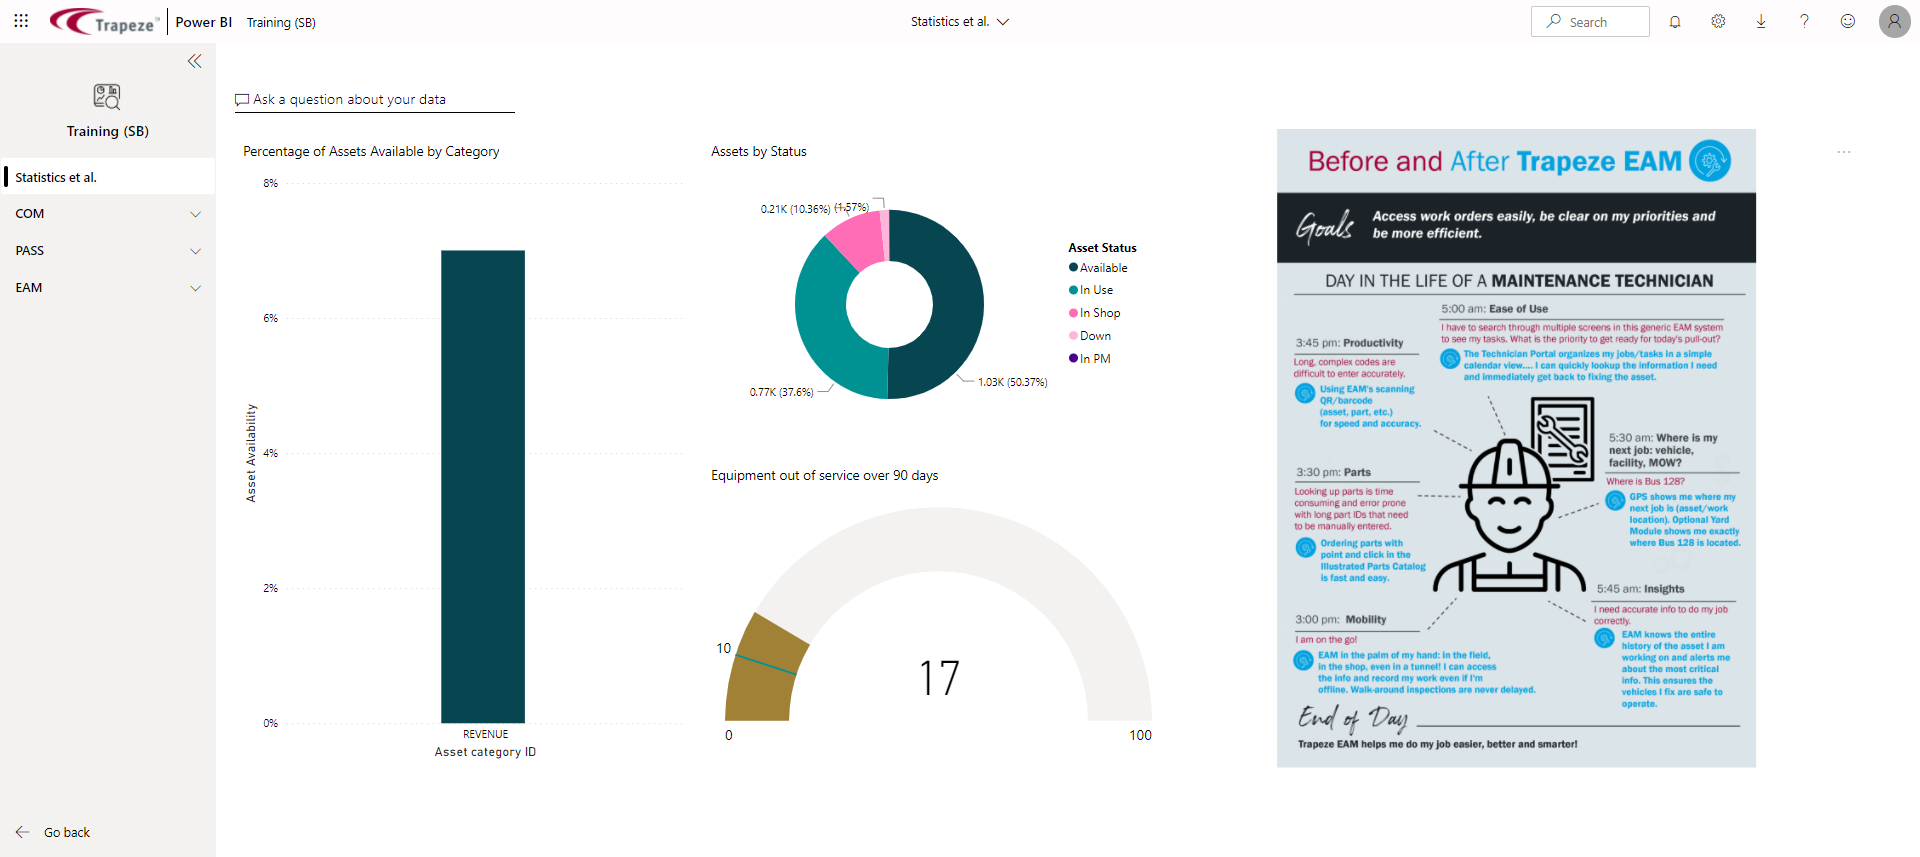
Dashboards are designed to provide a one-page at-a-glance overview.
Note: Not all of the information included here is applicable to
every dashboard. What you see is a result of how the dashboard was
designed.
-
In the app, select the dashboard name.
The dashboard appears.
-
To view the contact information for the dashboard power user who created it,
select the Find detailed information about this dashboard
option in the title bar.

-
Select dashboard tiles to open related reports.
If the power user who created it has used a custom link, the dashboard tile may redirect you to somewhere other than the original report.
-
If available, Ask a question about your data.
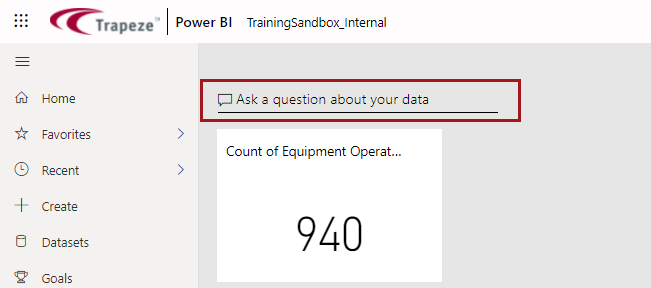
The Q&A feature is best used after you have a solid understanding of your data and the questions you want to ask. The system will make suggestions, but knowing the terminology used in your data will help you create questions it can understand and answer for you. -
Hover over a tile to show More options (…) and select an
option.
Available options are based on the visual type.
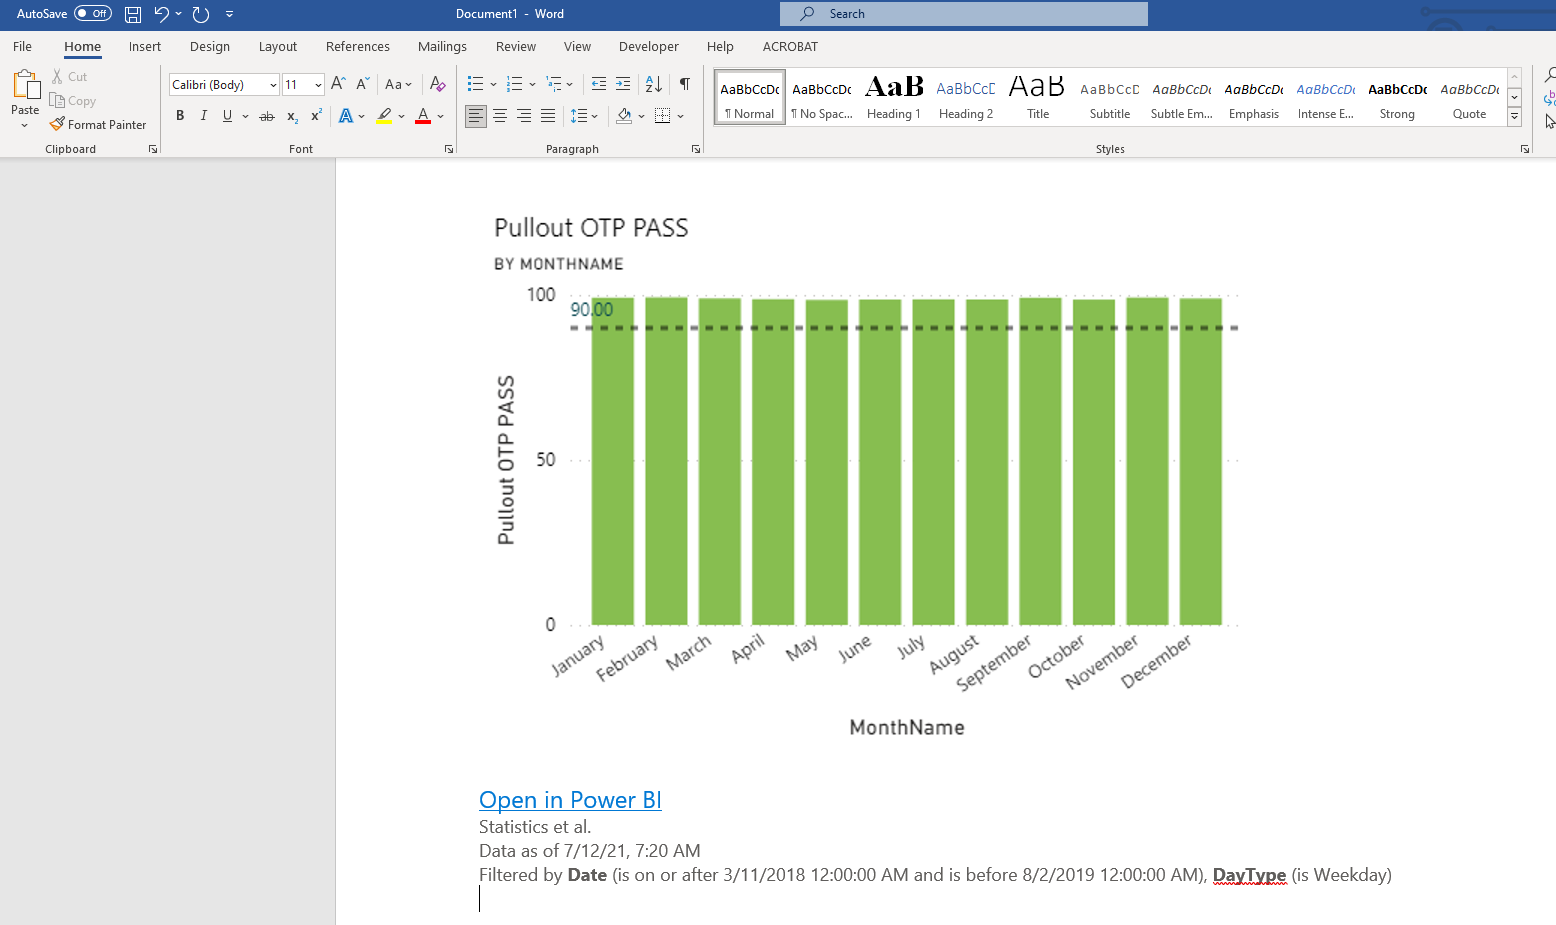
- Copy visual as image. Copy the visual to paste
into other applications. For example, Microsoft Word.
- Export to .csv. Downloads a .csv file.
- Go to Q&A. Opens the Q&A area so that you can ask questions about your data.
- Go to report. Opens the report from which the tile was created.
- Manage alerts. Opens the Manage alerts dialog.
- Open in focus mode. Opens the tile in its own window.
- Open hyperlink. Opens the linked address when a custom link has been added to the tile.
- Copy visual as image. Copy the visual to paste
into other applications. For example, Microsoft Word.