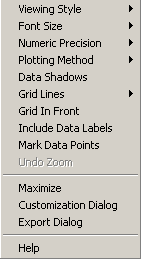
Using the Shortcut Menu
The items on the shortcut menu are:
| Menus Items | Descriptions |
|---|---|
| Viewing Style | View the graph in Color (default) using the colors you selected in the Properties feature, in Monochrome (black and white) or in Monochrome +Symbols. |
| Font Size | Choose Large, Medium (default), or Small depending on the size of the text you want to use. |
| Numeric Precision | Choose No Decimals (default), 1 Decimal, 2 Decimals, or 3 Decimals depending on how accurate you want the graph to be. |
| Plotting Method | Choose any of the following methods depending on how you want the data
represented on the graph:
|
| Data Shadows | Not implemented |
| Grid Lines | Choose Both Y and X Axis (default), Y Axis, X Axis, or No Grid. |
| Grid In Front | If selected, places the grid before the graph. |
| Include Data Labels | If selected, the node aliases appear on the graph. You must select Yes for the Show Labels option in the Properties dialog box for this item to appear on the menu. |
| Mark Data Points | If selected, dots marking the start and end of the lines appear on the graph. |
| Undo Zoom | Returns format of graph to initial setting. |
| Maximize | Enlarges the graph to cover the entire screen. |
| Customization Dialog | Opens the Customization dialog box. The dialog box can also be accessed when you right-click anywhere on the graph. For information on the Customization dialog box, contact your Trapeze representative. |
| Export Dialog | Enables you to save the graph to the clipboard or to a file or to print it directly to a printer. For information on the Export dialog box, contact your Trapeze representative. |