About the Single Track Tool
The Single Track Tool dialog allows you to view rail trips on a single track over a specific time period in a histogram.
While the Single Track Graph tool provides a report of track overlaps for both directions and all lines, the Single Track Tool dialog allows you to look for overlaps in each direction on a selected line and to shift the times of the trips.
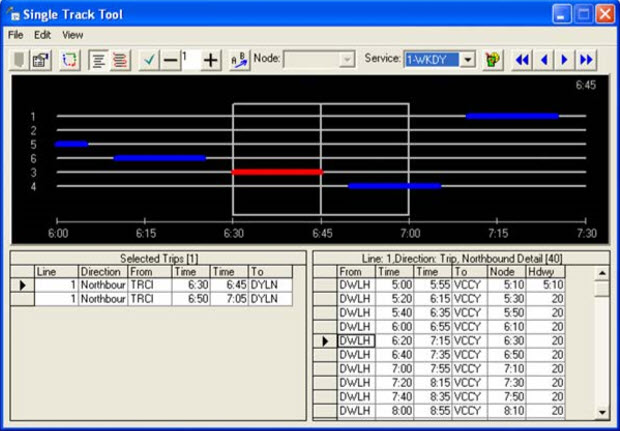
On the upper pane of the dialog, a histogram (shows a rectangle divided into two boxes at the midpoint of the time line) appears. The rectangle encompasses the time period within which you can search for trips that overlap between selected node pairs. (The time period is set in the Parameters dialog.) The time at the midpoint appears in the upper right corner of the histogram.
Only the values of the selected trip in the Selected Trips grid are shown in the histogram. The trips occur within the time period set in the parameters. The markers (darker lines) represent the times when the vehicle enters and exits the section between the node pair. Overlapping markers indicate that two vehicles on trips from different lines are in between the nodes at the same time.
To shift the trip times, grab the line in the middle of the rectangle and drag the rectangle forward or backward. One marker that has part of it within the rectangle changes color. Note the changes applied on the time at the midpoint and the times in the bottom right grid.
The Selected Trips (left) grid shows the lines and blocks with which the selected nodes are associated and the From and To times of the trips. The right grid shows the details of the block to which the selected trip belongs.