About the Transfer Tool Screen
The Transfers Tool screen contains a line graph that shows data based on the parameters you set in a Parameters dialog.
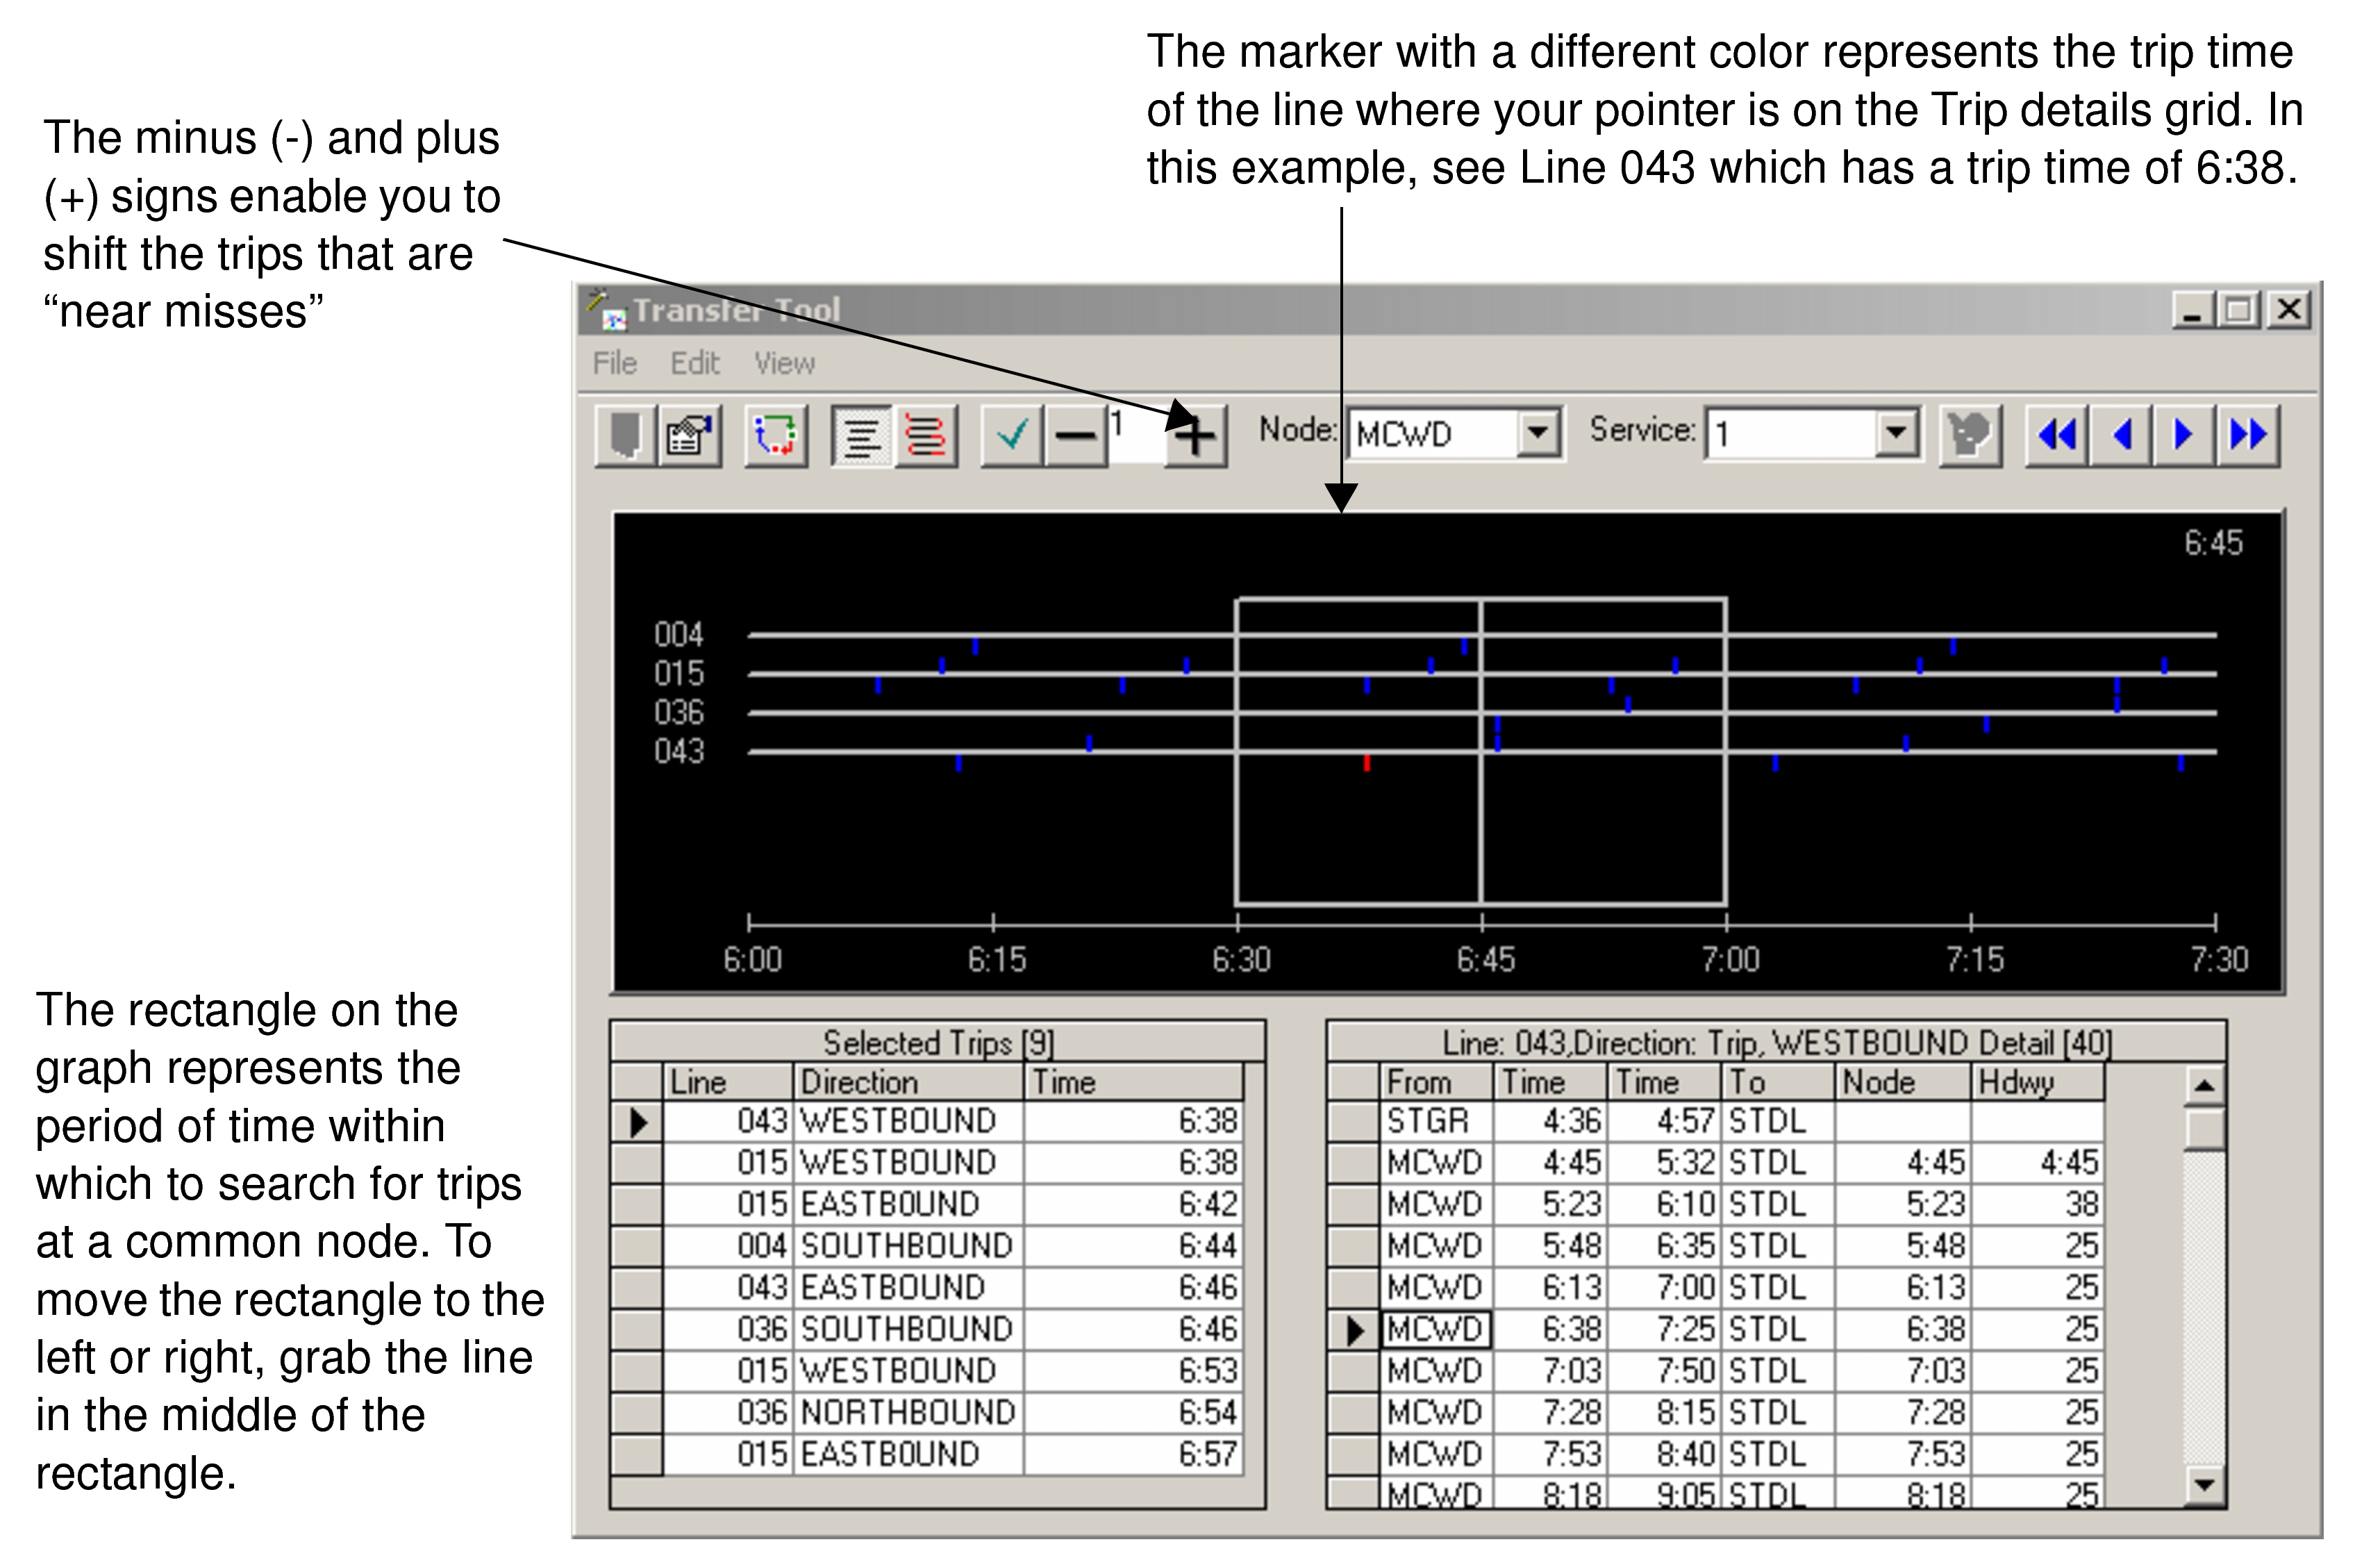
A rectangle divided into two boxes appears at midpoint of the time line. The rectangle encompasses the period of time within which you can search for the trips that meet at a common node. To move the rectangle to the left or right, grab the line in the middle of the rectangle. The time at midpoint appears in the upper right corner of the graph. The markers on the horizontal lines are in one color.
The minus  and plus
  signs enable you to shift the trips that are "near misses". The marker with a
different color represents the trip time of the line where your pointer is on the Trip
details grid. In this example, see Line 043 which has a trip time of 6:38.
signs enable you to shift the trips that are "near misses". The marker with a
different color represents the trip time of the line where your pointer is on the Trip
details grid. In this example, see Line 043 which has a trip time of 6:38.