About Viewing the Route Definition Grids
You can view both grids simultaneously or if you have a large volume of data, view only one grid at a time.
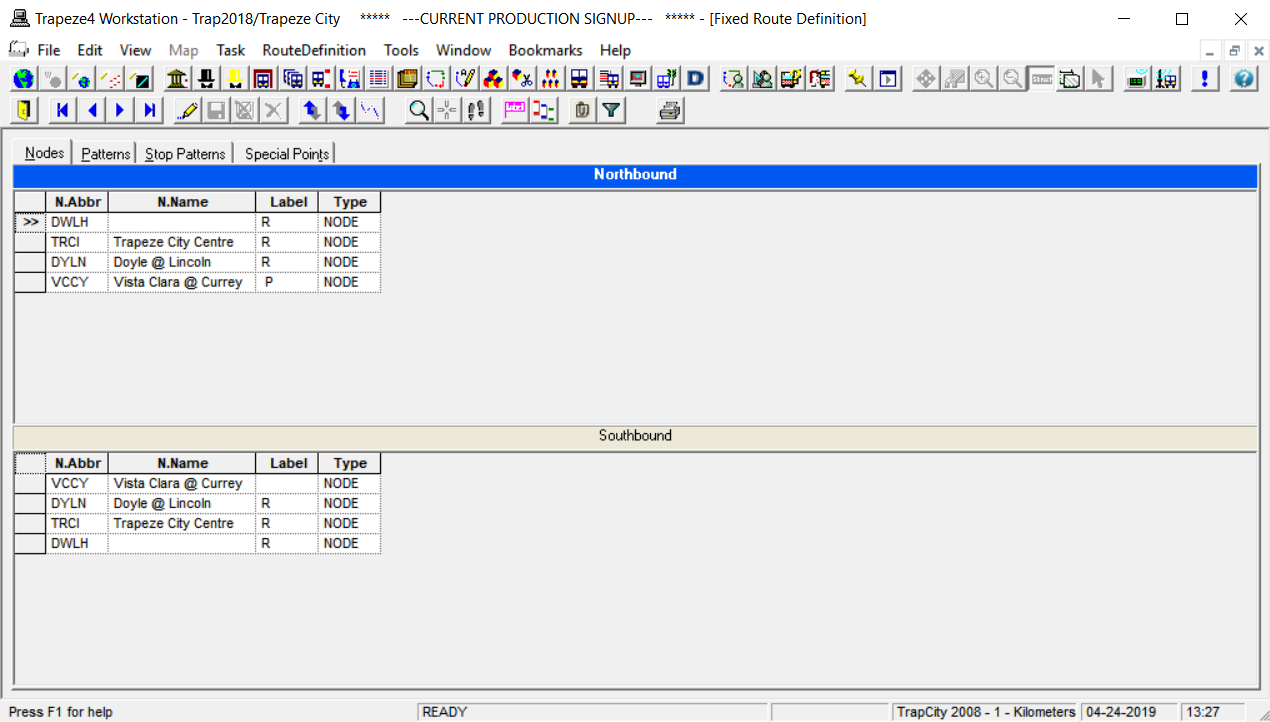
Typically, the first direction bar, for example, Northbound, is highlighted while the second grid, which may be Southbound, is not. To toggle between the two views, click the direction bar of the grid you want to view. The grid expands while the second grid disappears. To minimize the selected grid and return the second grid to the screen, click the direction bar again.
You can adjust the width of the columns. When you add or remove a column from a grid, the system retains the width of the columns that you reset in subsequent sessions. The width of Nodes columns on the Patterns grid are set back to the default because the number of nodes vary depending on the line context.
To view columns that are not within view on the screen, click the horizontal scroll bar. Only the columns that display times now move to the left or right depending on how the scroll bar is dragged. If you scroll to the right, the columns on the left remain static while the node columns, starting with the first node appear to slide under the static columns as the hidden columns are displayed.
The grids are read-only if the selected sign-up period in the Context dialog box has been marked as Frozen (in the Sign-up Period Edit dialog box). Most of the options in the shortcut menu on the different tabs also appears shaded.
When you select all of the data including the supplementary data on a grid in a Route Definition screen, you can paste the data into an Excel spreadsheet.
After making changes on the data and you choose to open a tab on the screen or move to another FX screen, a message appears asking if you want to save or discard your changes.