Place text in quotation marks for exact match search results.
Route Profile Report
The Route Profile report summarizes passenger count data for a route or several routes.
The data is grouped into four time periods: AM Peak, MidDay Peak, PM Peak, and Off
Peak.
This report allows you to analyze ridership trends throughout the day (that is, when
transit service is at its highest or lowest demand). As a whole, these peak intervals make
up a 24-hour period.
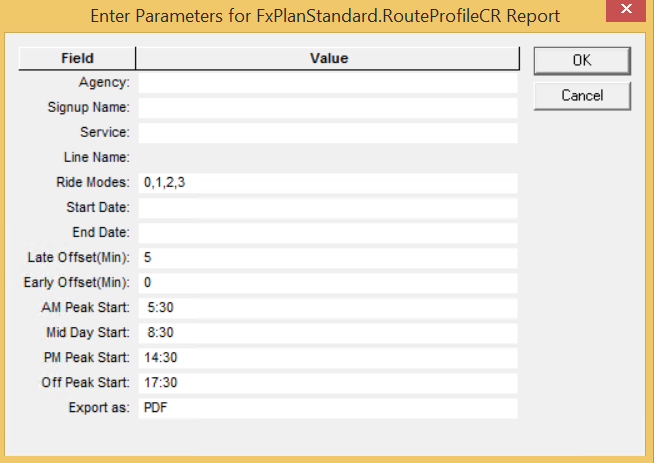
The following graphic shows the parameters of the report:
Parameter
Description/Options to be selected
Agency
(If applicable) Some transit organizations that offer continuous transit service
across several geographical areas consist of several units identified as agencies. For
example, these agencies may be categorized by transportation mode.
Signup Name
Sign-up period
Service
Only the Service abbreviations and Service names of the selected sign-up period
are shown in the list.
Line Name
Only the Line IDs and Line names of the selected sign-up period are shown in the
list.
Ride Modes
Sample options on methods used to perform checks: Riding Survey Sheet, Riding
Handheld, Automated, Random, Point Survey Sheet, and Point Handheld.
Start Date
Start of the date range covered in the report.
End Date
End of the date range covered in the report.
Late Offset (Min)
The default is ± 5 minutes.
Early Offset (Min)
The default is 0 minutes.
AM Peak Start
Time when the PLAN AM Peak period starts. (When Peak periods are added to the
Service Groups ancillary data, users have an option of specifying where they would be
used: FX or PLAN.)
Mid Day Start
Time when the PLAN Mid Day Peak period starts.
PM Peak Start
Time when the PLAN PM Peak period starts.
Off Peak Start
Time when the Off Peak period starts.
Export as
Report format options are: PDF, CSV, Excel (spreadsheet), RTF, and Word (word
processor). Set to PDF by default.
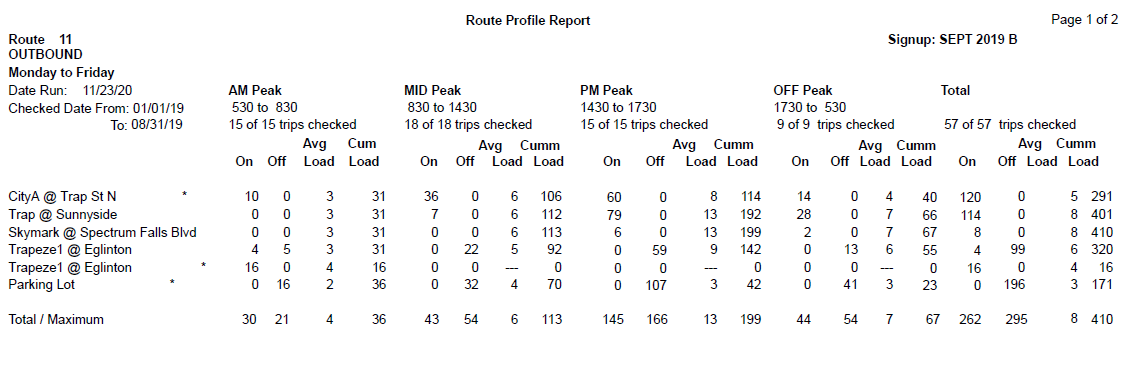
Sample Route Profile Report
The following graphic is an example of a Route Profile report: