Place text in quotation marks for exact match search results.
Changing the Appearance of Polygons on Map
You can change the appearance of polygons or the color of an individual polygon type on the system map.
On the Demographics tab in the PLAN Options
dialog box, click Ranges.
The Ranges dialog box appears.
Do one of the following steps:
Double-click the appropriate polygon color on the lower-right side of the
Data Ranges dialog box.
From the color palette, select a polygon color, and then click
Modify.
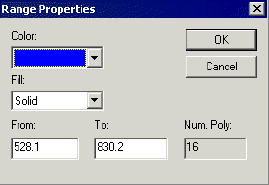
The Range Properties dialog box appears.
Do either or both of the following steps:
Change the color and fill of the individual range of polygons.
Examine a subset of a range of polygons by entering new values in the
From and To fields. You can also change
the color of this subset to make it stand out more clearly.
The values in the From and To fields are
derived from the actual data in the selected table. By default, the values are divided on
natural breaks in the data.