Using Dashboards
Dashboards are designed to provide a one-page at-a-glance overview.
-
To view the contact information for the dashboard power user who created it,
select the Find detailed information about this dashboard
option in the title bar.

- Select dashboard tiles to open related reports.
-
If available, Ask a question about your data.
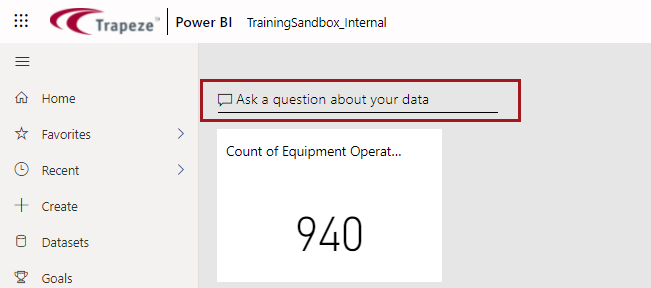
Using the Q&A feature opens up additional dashboard options in the dashboard toolbar.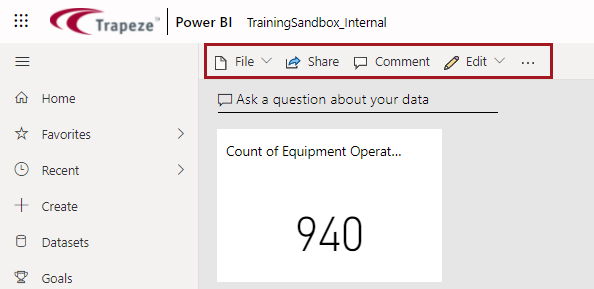
-
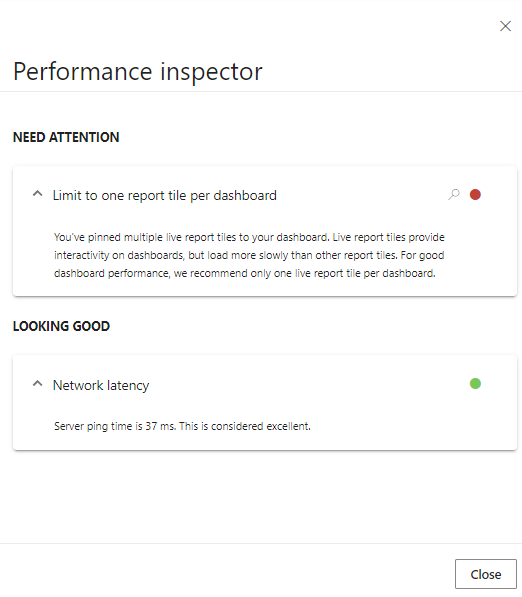
To check the performance of the dashboard, select .
The Performance inspector provides details about performance and suggestions about performance improvement.
-
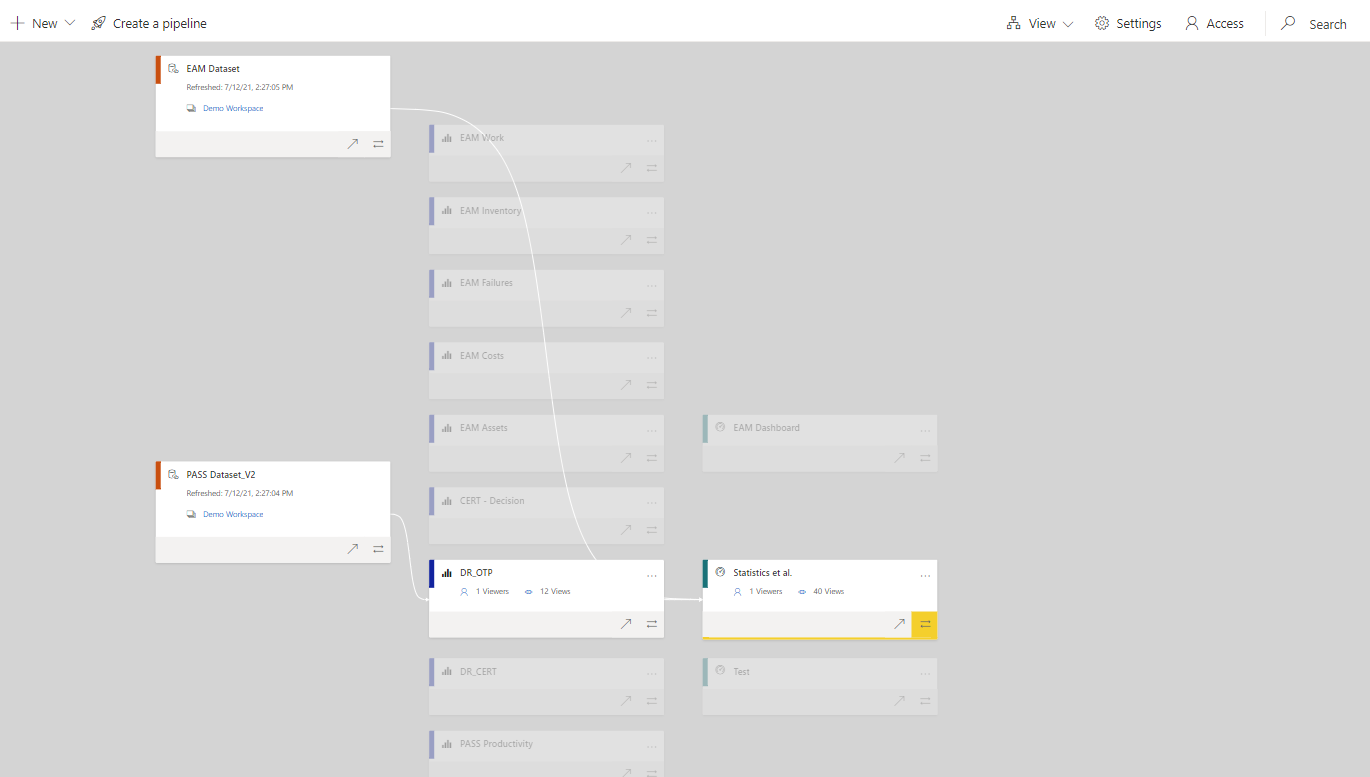
To see how the dashboard content relates to other content and how it is being
used, do one of the following:
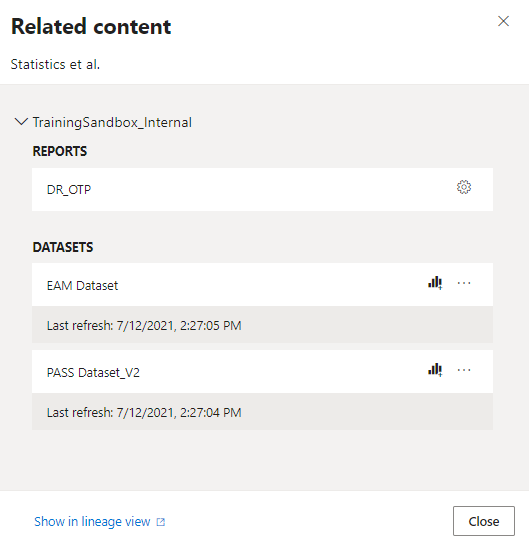
- In the dashboard toolbar, select . This shows how the current dashboard relates to other
dashboards, reports, and datasets, and lets you access available related
content.
- In the dashboard toolbar, select . This shows where in the hierarchy of the workspace the
dashboard exists and lets you check for any dependencies that might affect
your data.
- Select . This shows information about who is using the available data and lets you track things like views per day and views by user.
- In the dashboard toolbar, select . This shows how the current dashboard relates to other
dashboards, reports, and datasets, and lets you access available related
content.