About Reports
Reports are the building blocks from which dashboards and apps are created.
How you work with reports depends on whether you are a power user creating reports or a consumer viewing and customizing shared reports.
Reports contain one or more pages and are made up of visuals and other content (for example, images). Power users create reports with as much detail as needed and organize them so that consumers can focus on relevant information and quickly find what they need to know.
Note: ViewPoint uses Microsoft Power
BI guest user accounts, which limit available functionality. For example, you cannot
use the Analyze in Excel option or @mention other users in
Comments.
Reading View Report Components
Consumers work with reports exclusively in Reading view, where they view reports,
apply filters, and personalize visuals. Power users can work in Reading view or in
Editing view.
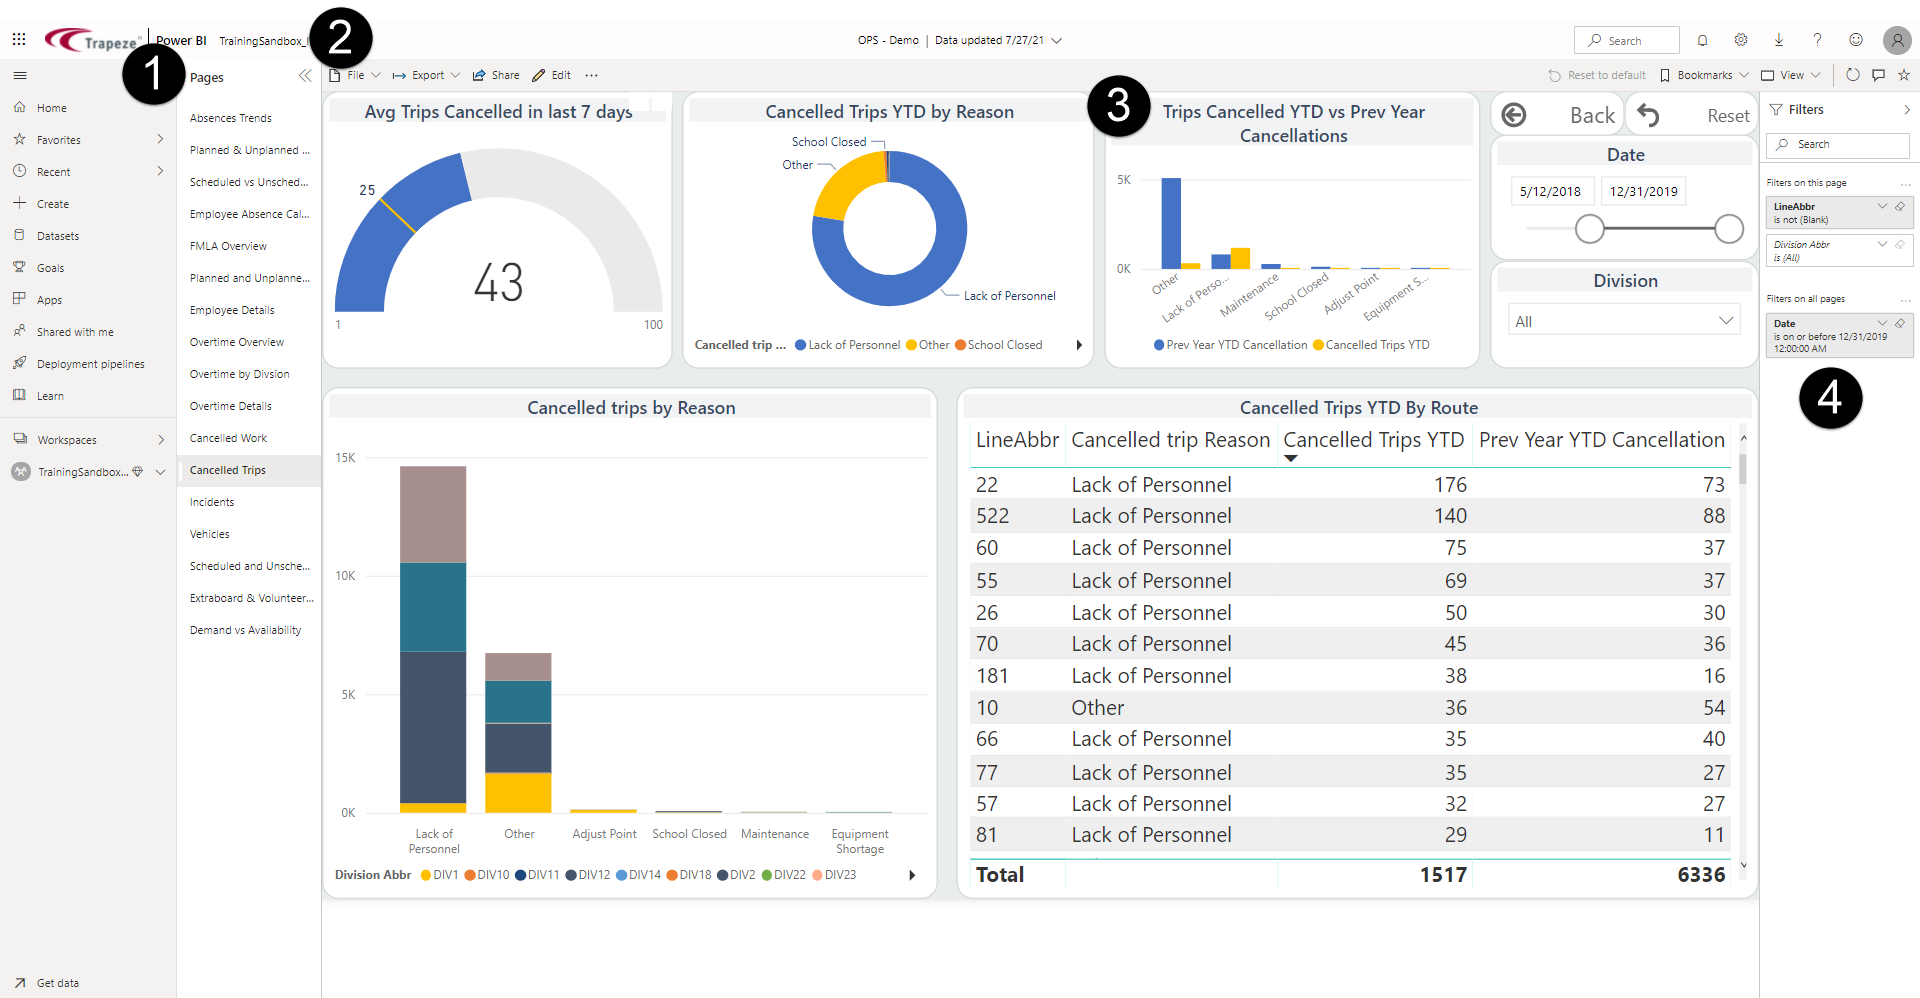
- Pages pane. Lists the pages in the report. Select the double-arrowhead option to show or hide the list.
- Report toolbar. Shows tools for customizing reports.
The Edit option is only available for power users.
- Visual. Shows an illustrated version of selected
data.
Visual types (called visualizations) include donut chart, gauge, clustered bar chart, and table.
- Filters pane. Shows all filters at the report level, page level or filters for selected visuals.