Adding Filters to Reports
You can add filters to a report at the report, report page, and visual level.
Note: Fields that are marked as measures cannot be added to filters.
-
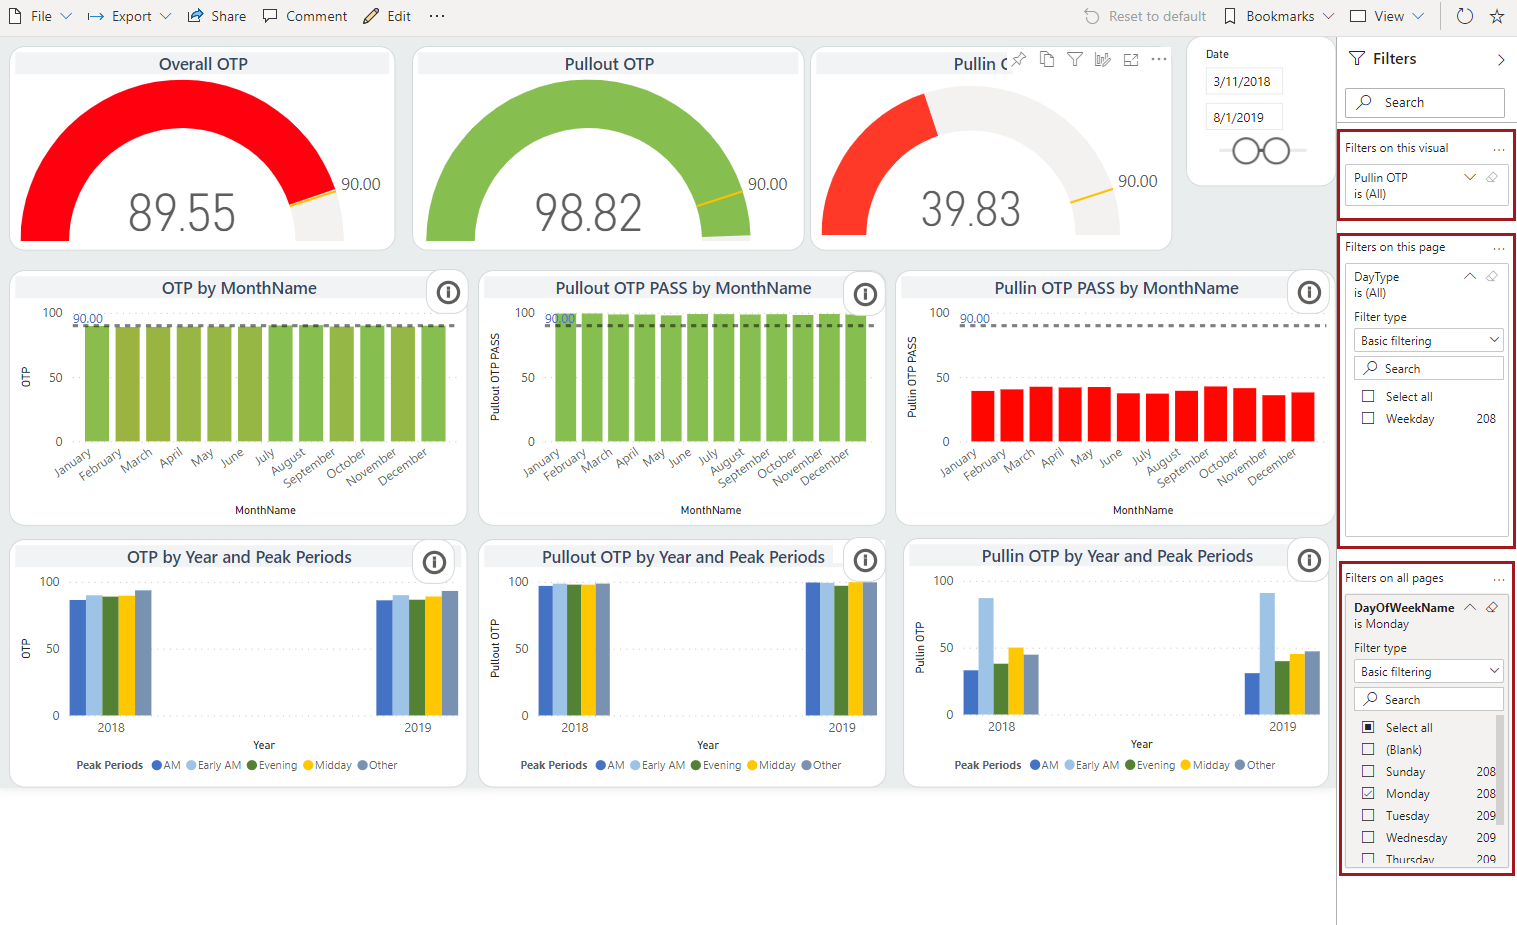
To add filters to all pages in the report, do the following:
- In the Fields pane, select the field to use as a report-level filter.
- Drag it to the Filters pane and drop it in the Filters on all pages section.
-
Use the Advanced filtering or Basic
filtering options to further refine the report
filtering. For example, if filtering by DayOfWeekName, you can refine
results to include only thing that happened on Monday.
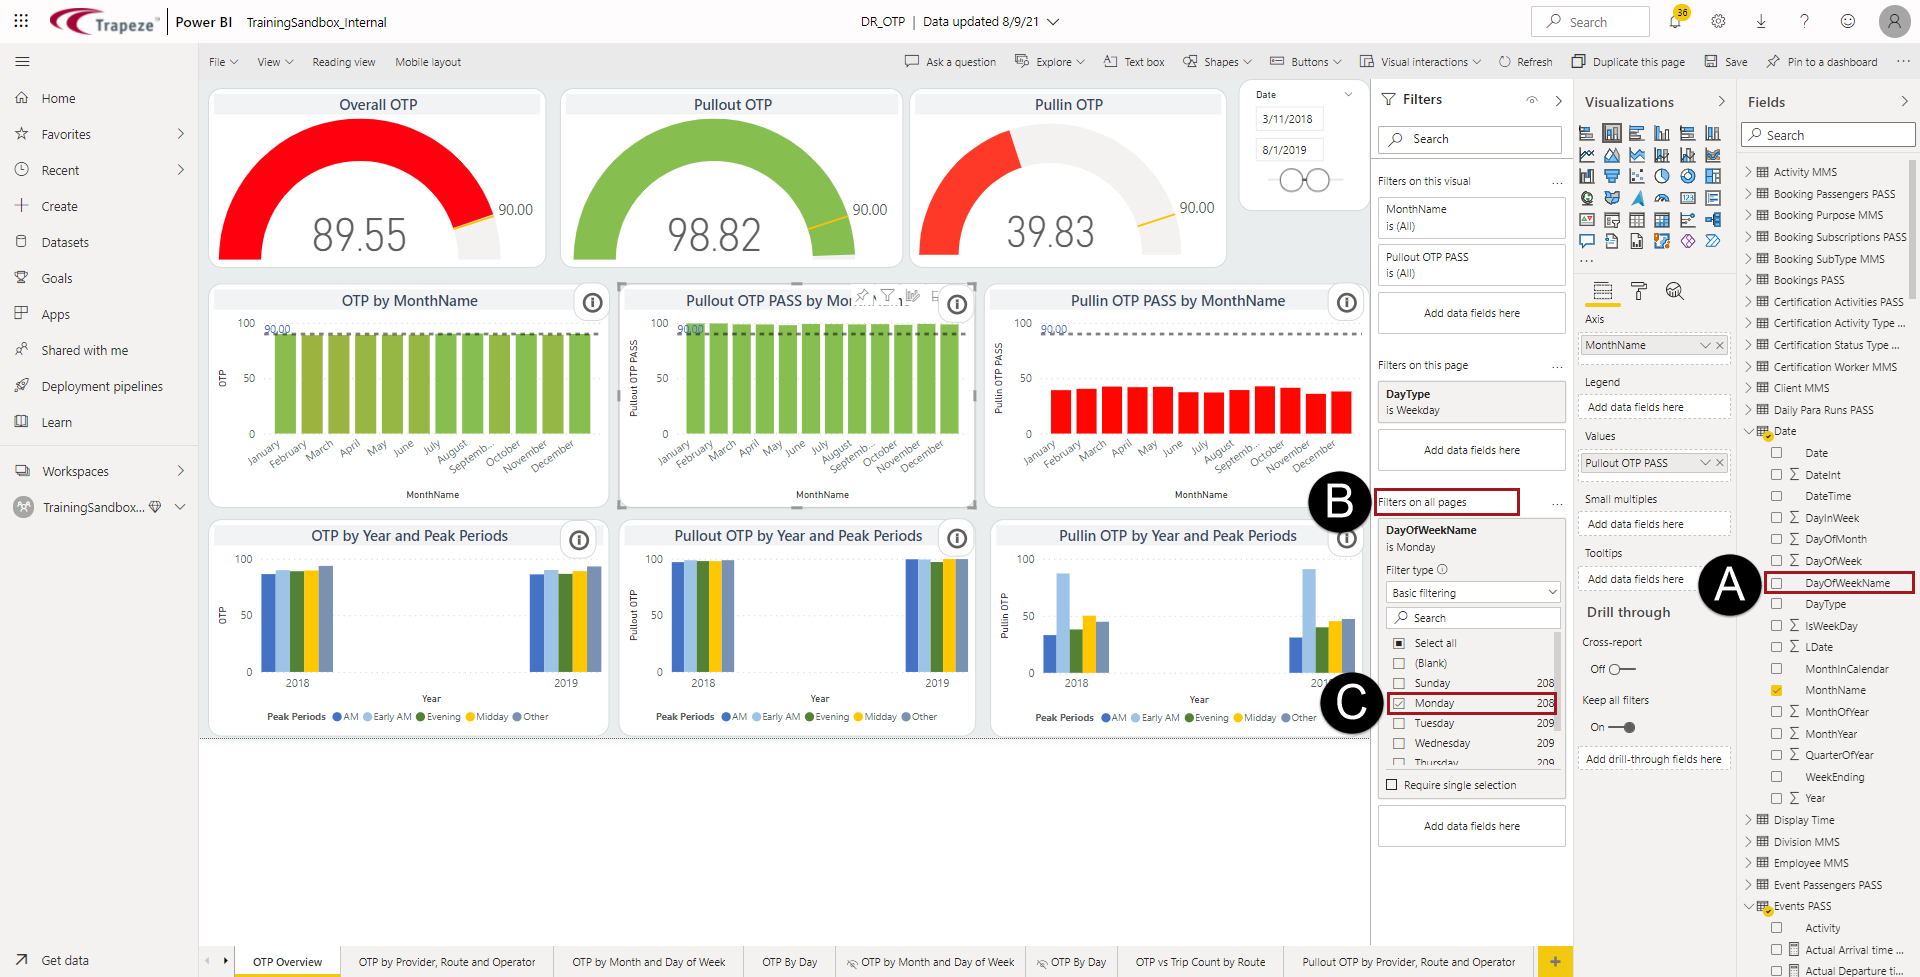
All visuals across all pages of the report use the new filter. -
To add filters to the report page, do the following:
- In the Fields pane, select the field to use as a page-level filter.
- Drag it to the Filters pane and drop it in the Filters on this page section.
-
Use the Advanced filtering or Basic
filtering options to further refine the report page
filtering.
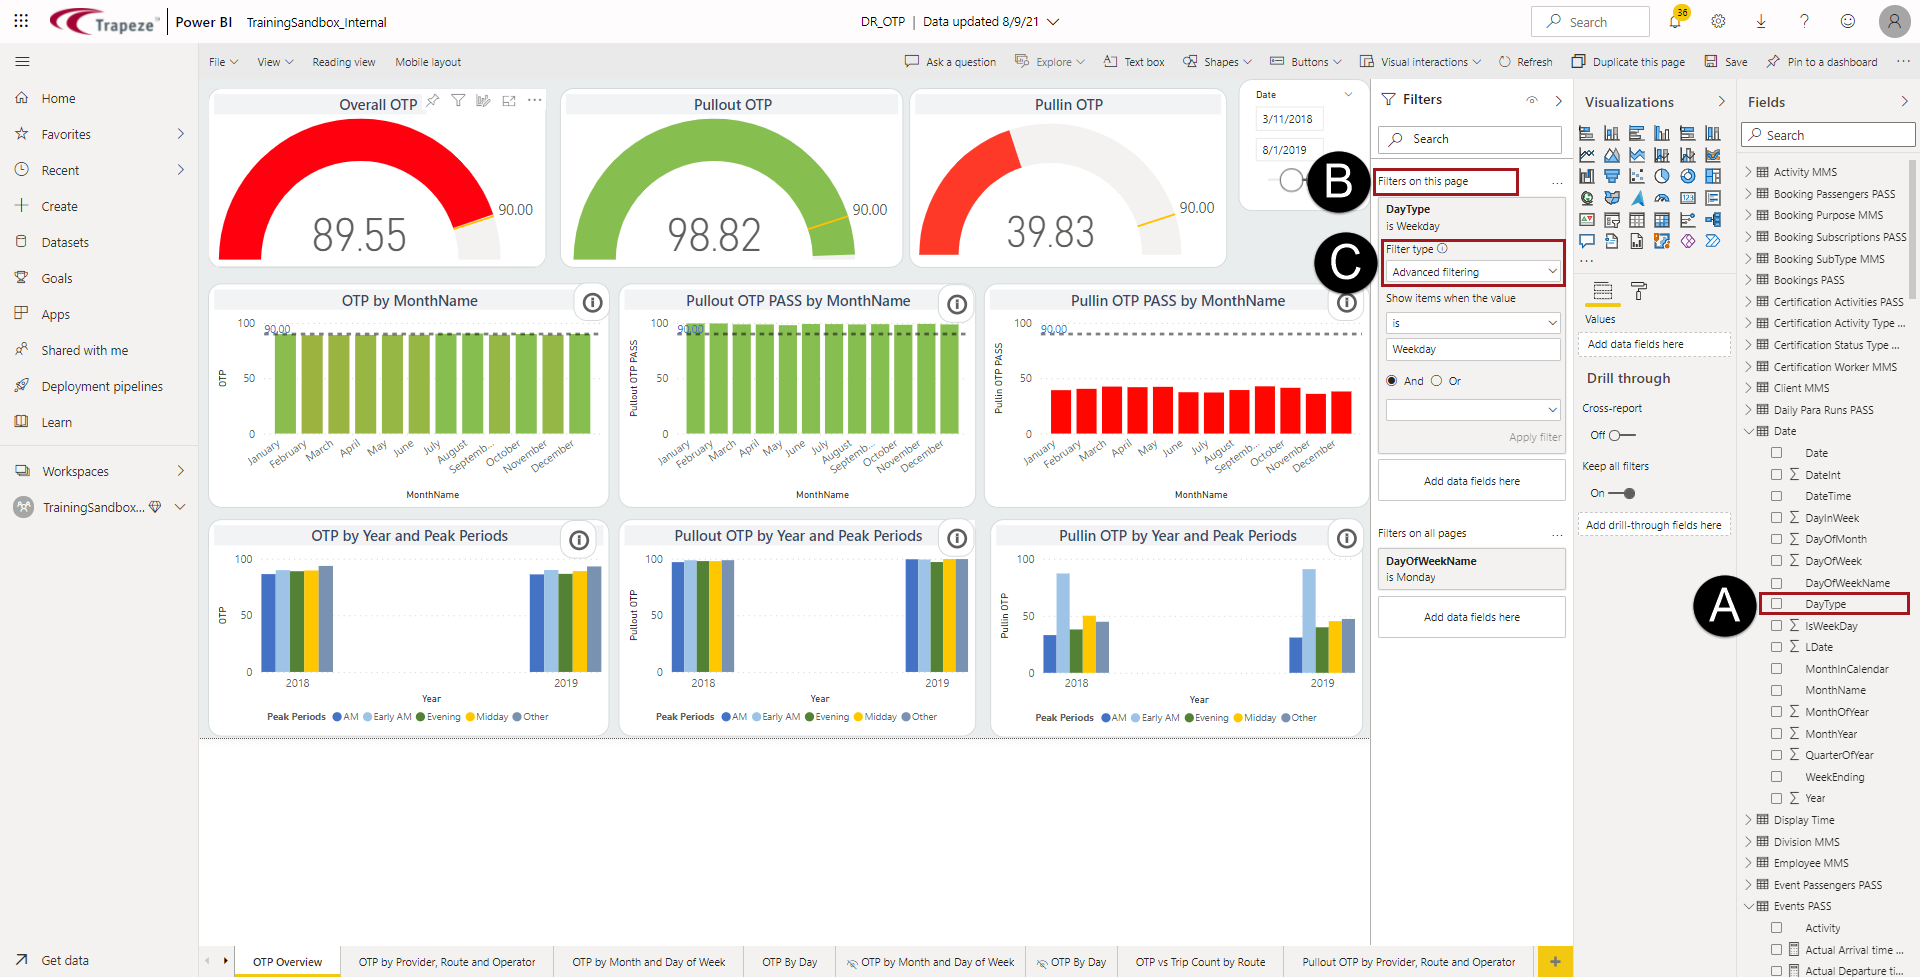
All visuals on the page use the new filter. -
To add filters to a specific visual, do the following:
-
Select a visual.
The Filters pane shows filters applied to the visual in the Filters on this visual section.
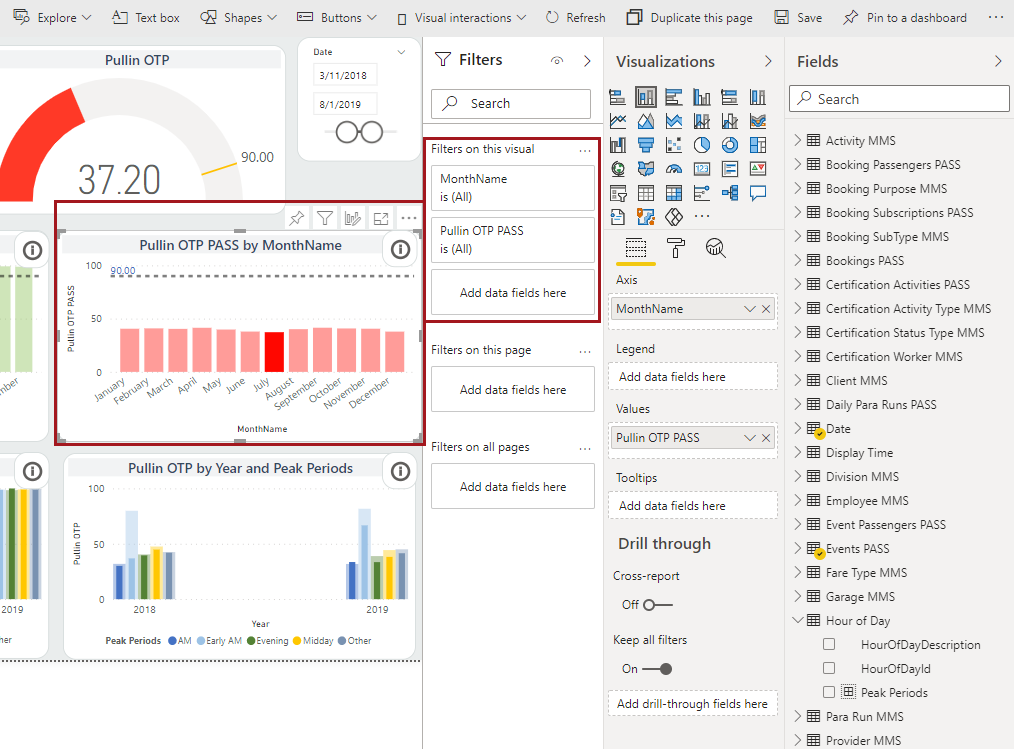
The filter is applied to the visual.Consumers are able to interact with available filters on the report, report page, and visual level.
-
Select a visual.
-
To prevent consumers from selecting their own values in filters, in the
Filters pane, select the eye symbol.
The eye symbol has a slash through it to indicate filters are hidden.