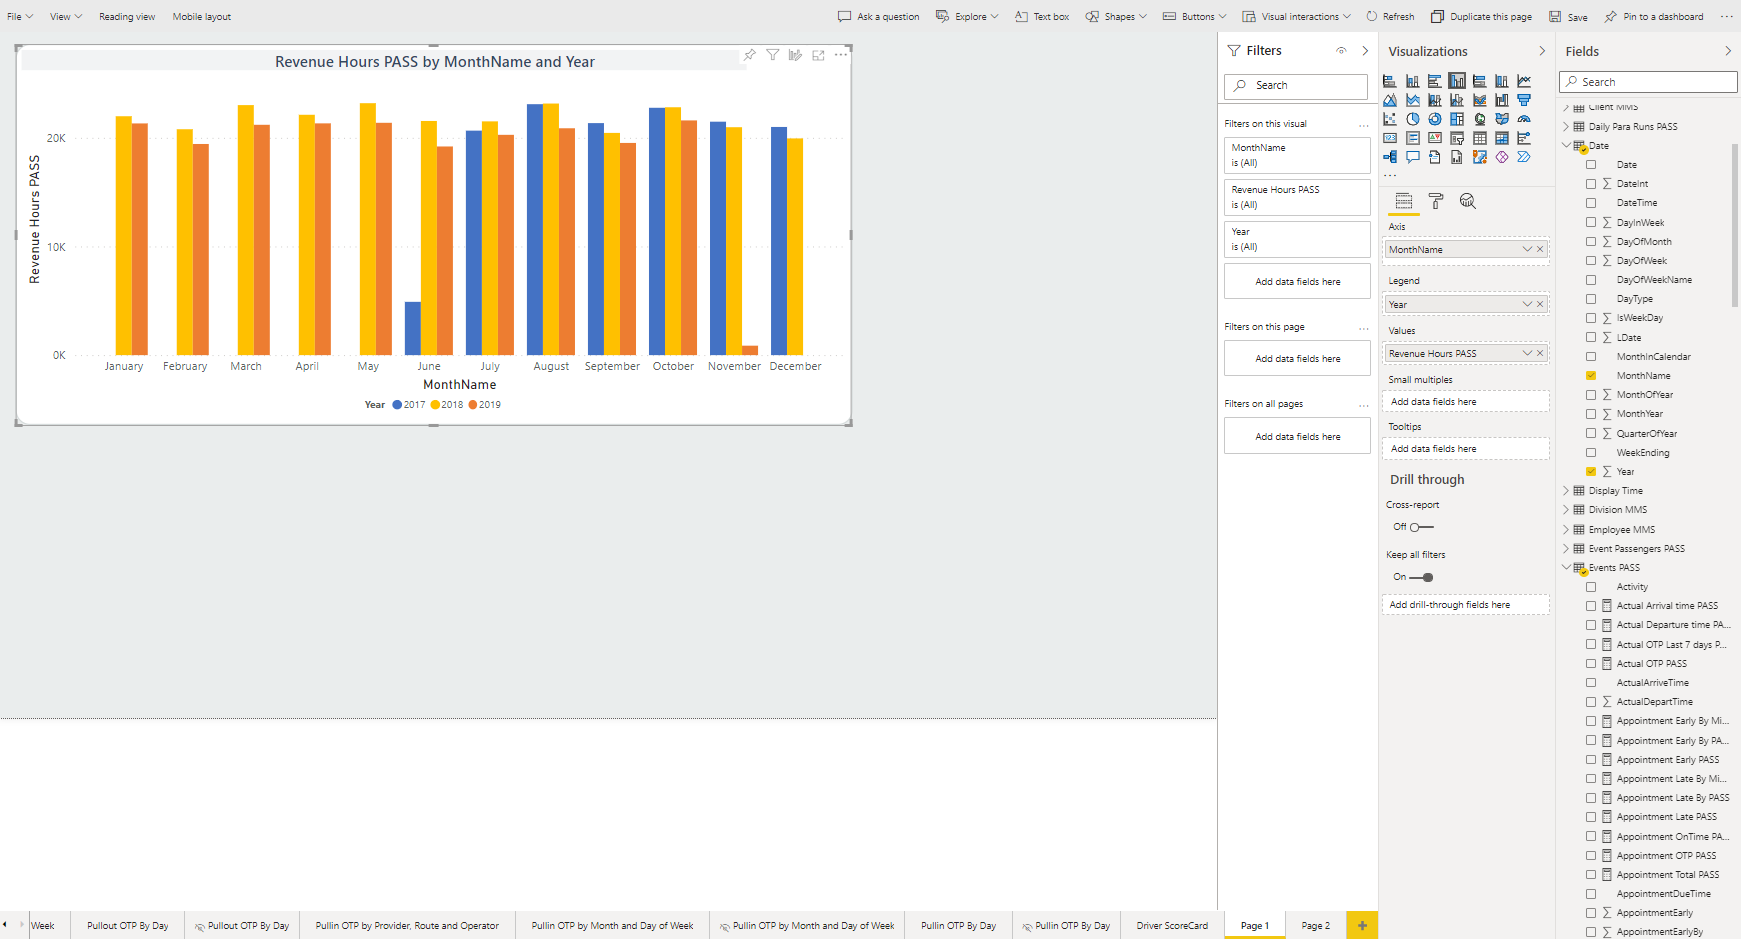
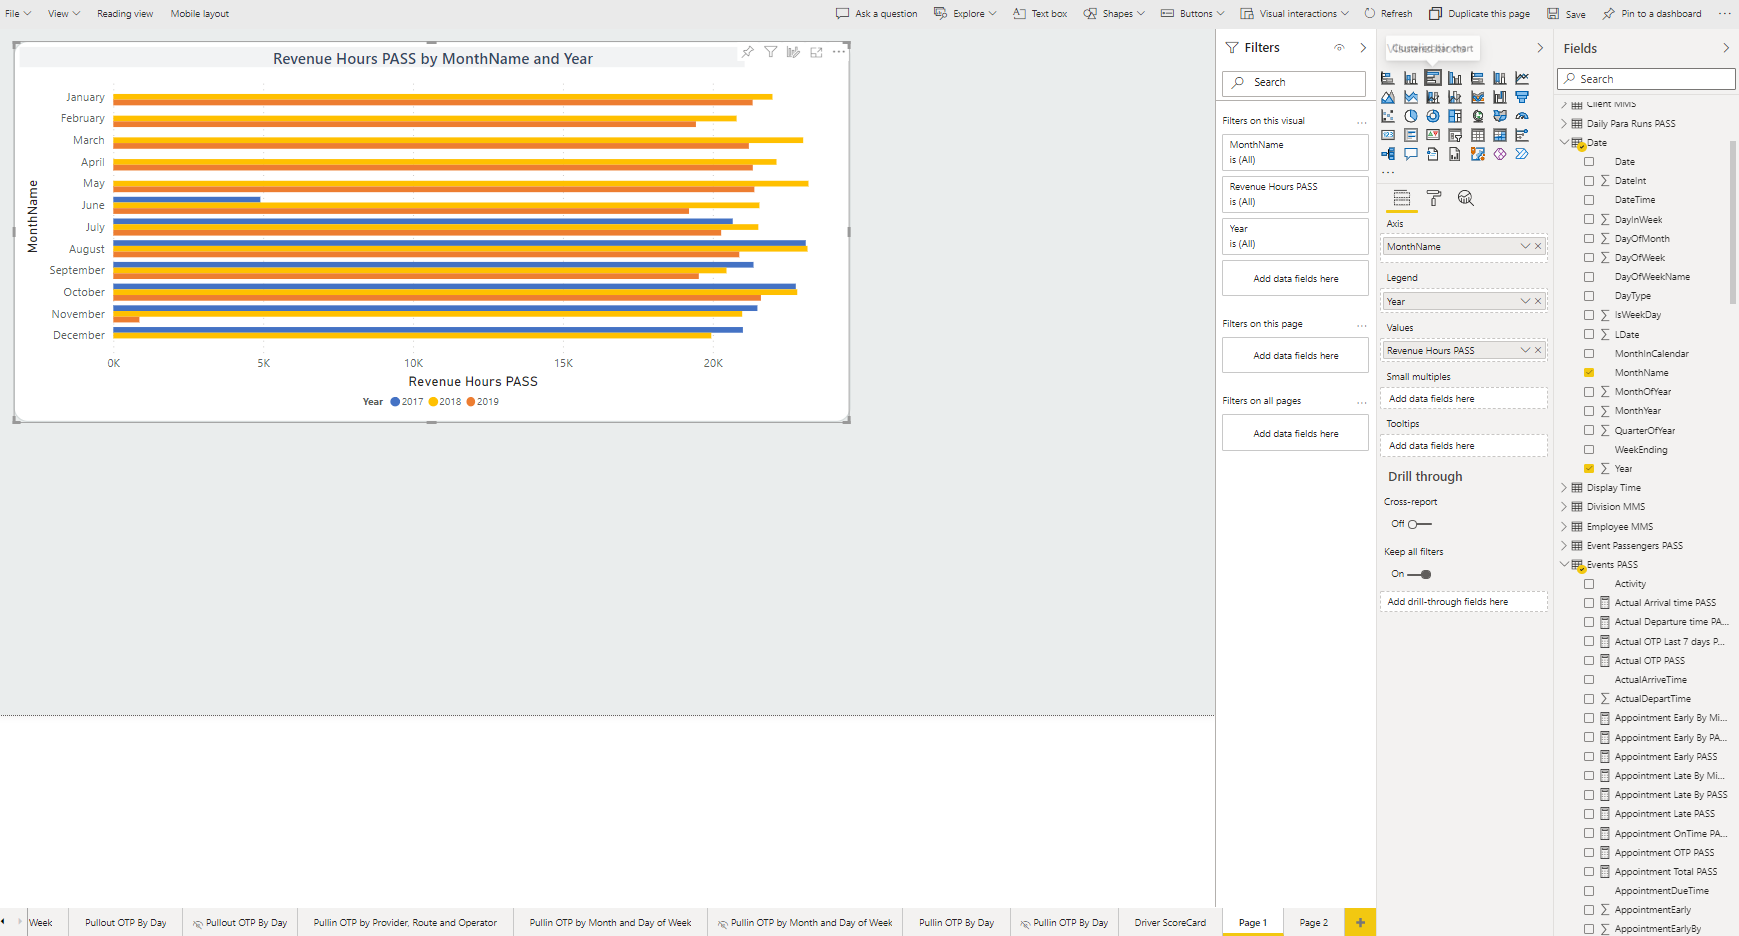
Creating and Formatting Visuals
Power users can create visuals and format them.
-
In the Fields pane, select the fields to include in the
visual.
The visual is added to the report canvas.
-
To change the visual illustration, select another chart type in the
Visualizations pane.
The visual is updated.
-
To select a cross-filtering or cross-highlighting action for a visual, do the
following:
Cross-filtering and cross-highlighting options let consumers easily see relationships between visuals in reports by removing or dimming unrelated content.
-
Select either the Filter or
Highlight option on the visual to be updated
when a data point in the trigger visual is selected.

If you don't see these options, they are not available for this visualization.You can also select None if you don't want visuals affected when data points are selected.
-
Select either the Filter or
Highlight option on the visual to be updated
when a data point in the trigger visual is selected.
-
To group visuals, press Ctrl and select the visuals to
group. Right-click and select Group.
Grouping lets you quickly move or resize related visuals.
-
Right-click on the visual to see other available options.
Options may change depending on the selected data point.
- Show as a table. Opens a table of the underlying data in a new page.
- . Copies the value in the selected cell.
- . Copies the selected row (and column headers).
- . Copies the visual.
- To delete the visual, in Editing view, select the visual and then .