Creating and Formatting Tables
Table visuals can be used to show exact values or to group numerical data.
- Open the report in Editing view.
-
In the Visualizations pane, select
Table.
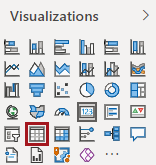
A table appears on the report canvas. - In the Fields pane, select the fields to include in the table.
-
Update the column order:
- Select the table visual.
- In the Visualizations pane, select Fields.
-
In the Values area, arrange the fields in the
desired order.
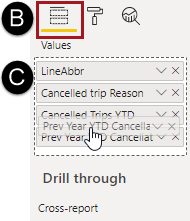
The columns in the table match the new field order.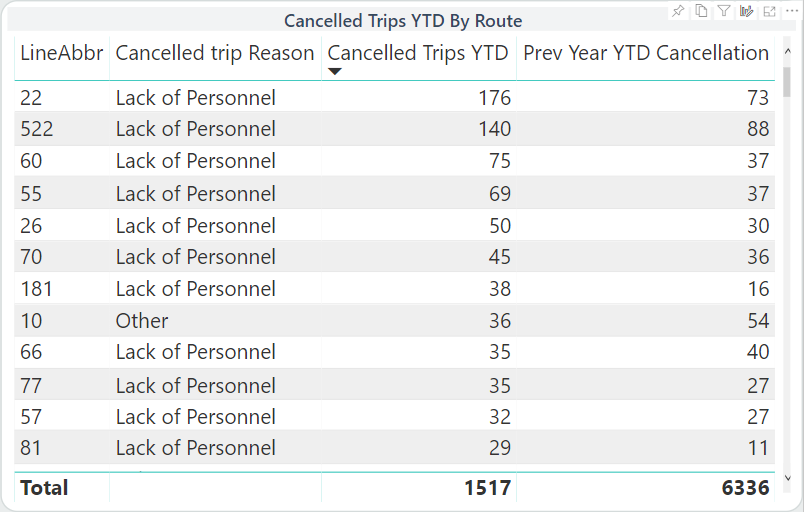
-
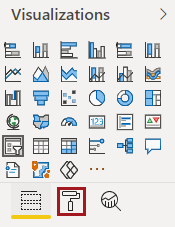
Format the table:
-
In the Visualizations pane, select
Format.
-
In the Visualizations pane, select
Format.