About Working with Reports in Editing View
Power users typically work with reports in Editing view, where they use their available datasets to create visuals, filters, and more.
Report Components (Editing View)
The report canvas in Editing view includes a number of components.
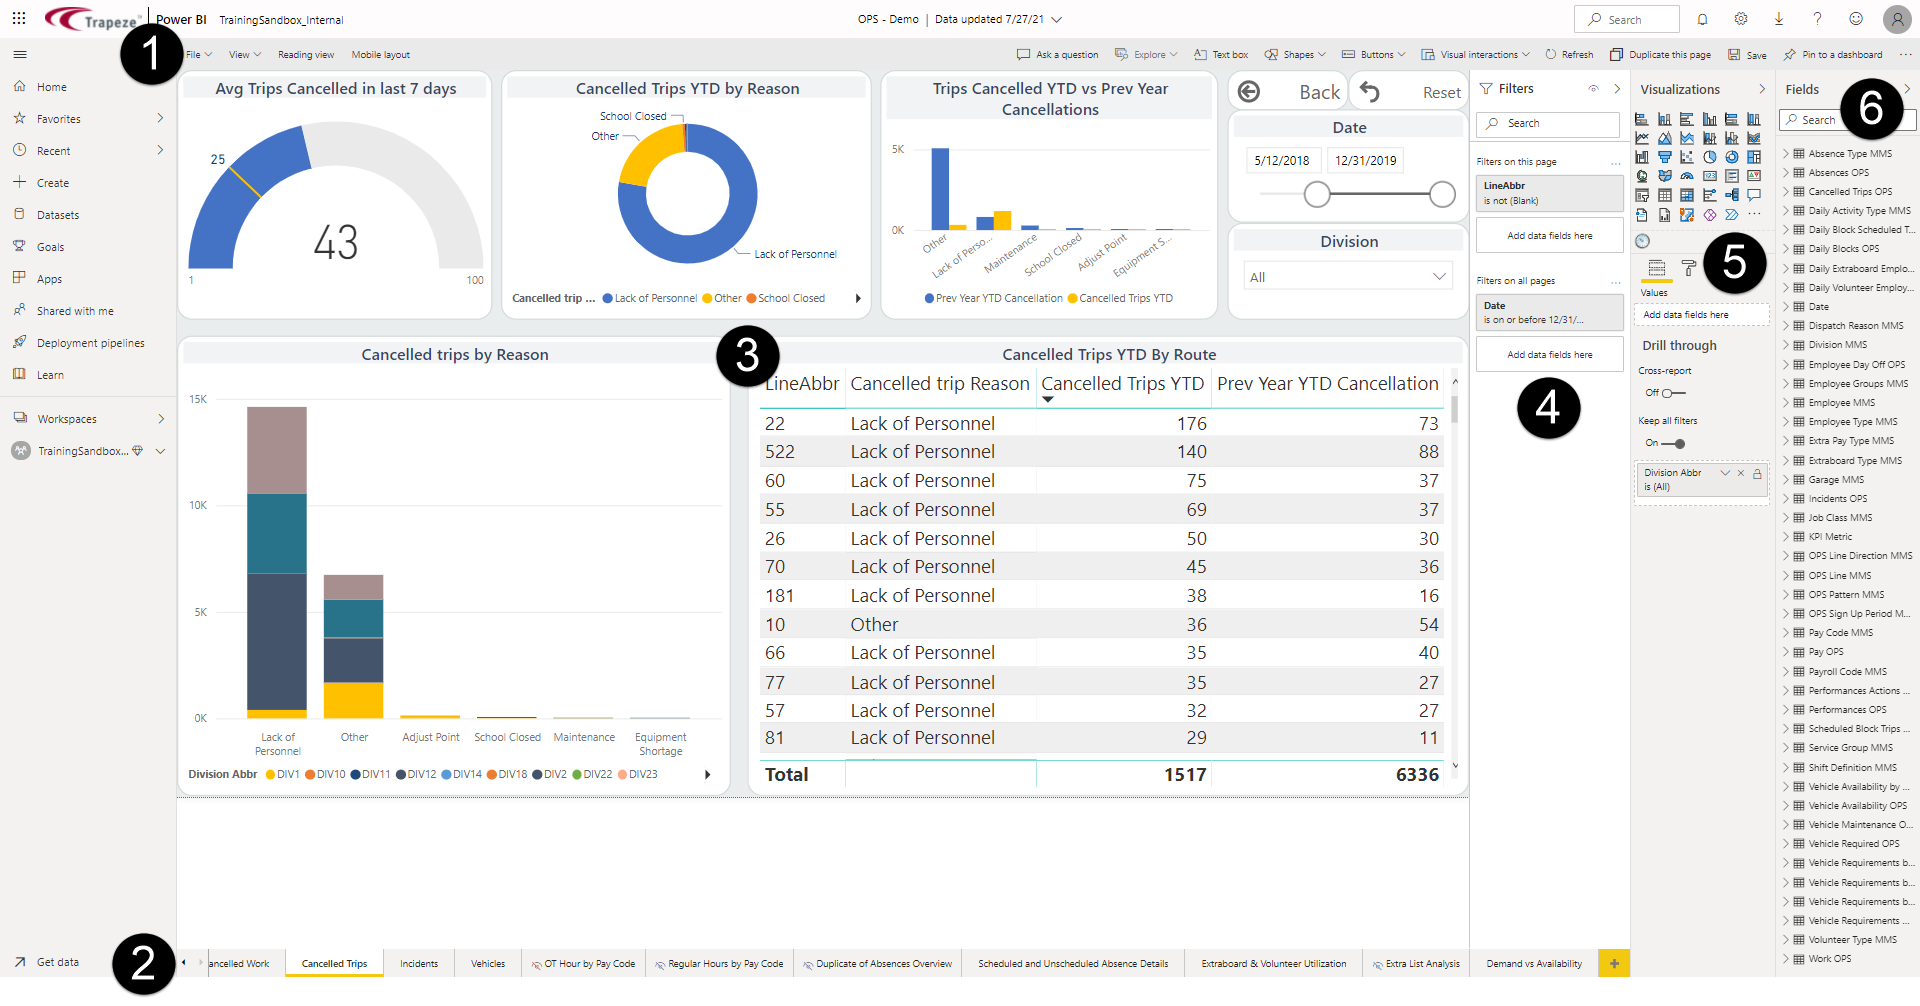
- Report toolbar. Shows tools for creating and modifying reports.
- Pages pane. Shows the different pages of the report.
- Visual. Shows an illustrated version of selected
data.
Visual types (called visualizations) include donut chart, gauge, clustered bar chart, and table.
- Filter pane. Shows all filters at the page level or filters for selected visuals.
- Visualizations pane. Shows options for formatting visuals and creating new visuals.
- Fields pane. Shows all the fields from the
dataset.
Fields that use hard-coded calculations are marked with a Measure icon:
 In ViewPoint, these measures are created by
Trapeze.
In ViewPoint, these measures are created by
Trapeze.Numeric fields are marked with a summation symbol:
