Creating Drillthroughs
Drillthroughs help consumers access more details related to visuals.
-
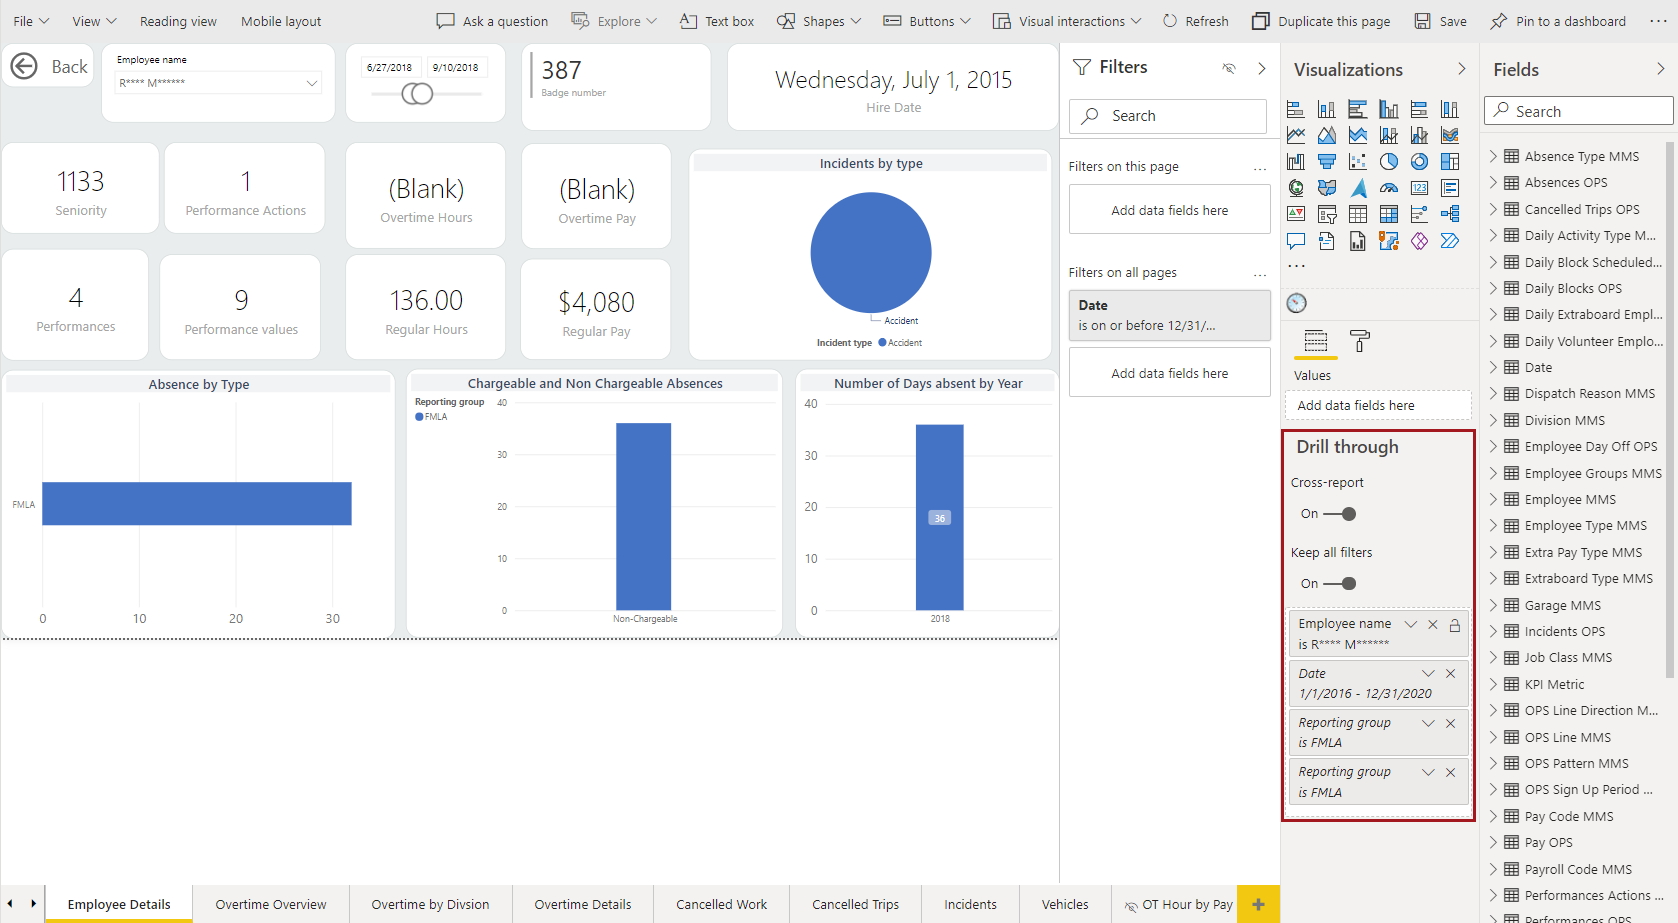
Create the drillthrough destination report page.
Visuals should relate to the data type using the drillthrough. For example, if you are sharing employee details, you might want to include visuals for seniority, performance actions, pay, and absences.
-
Select the created destination page visuals one at a time and drag fields into
the Visualizations pane in the Drill
through area.
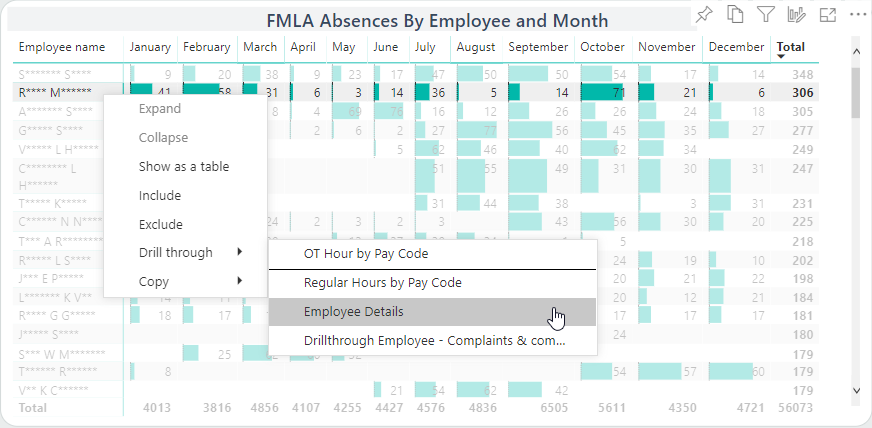
When these fields are included in other report pages, their data points become the trigger to show the Drill through option.A Back button is added to the report page.
-
In the Drill through field details, select Used
as category and add any desired filters.
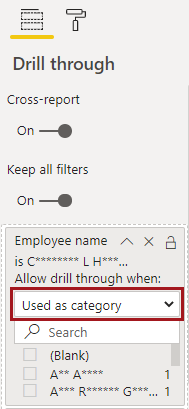
Visuals allow drill through when their Axis contains a defined drill through field (in the above example, Employee name). -
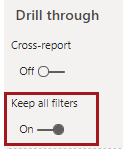
To allow consumers to apply the filter settings selected in the first report to
the drillthrough report, move the Keep all filters slider
to On.
-
To hide the destination page from the report pages navigation, right-click on
the report page and select Hide Page.
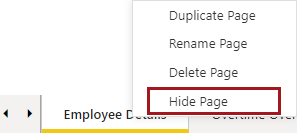
An eye icon appears to indicate the page is hidden.