Creating Drill Options
Adding drill options to a visual lets consumers drill into data in the current visual.
-
Select the visual to be updated.
Not all visuals support drill options. Axis must be an available field in the Visualizations pane.
- If you want multiple visuals to be affected by the drill options used in this visual, select .
-
Drag fields to be used in the drill hierarchy from the
Fields pane to the Visualizations
pane Axis or Shared axis area. (If
you are using a matrix visualization, use the Rows
area.)
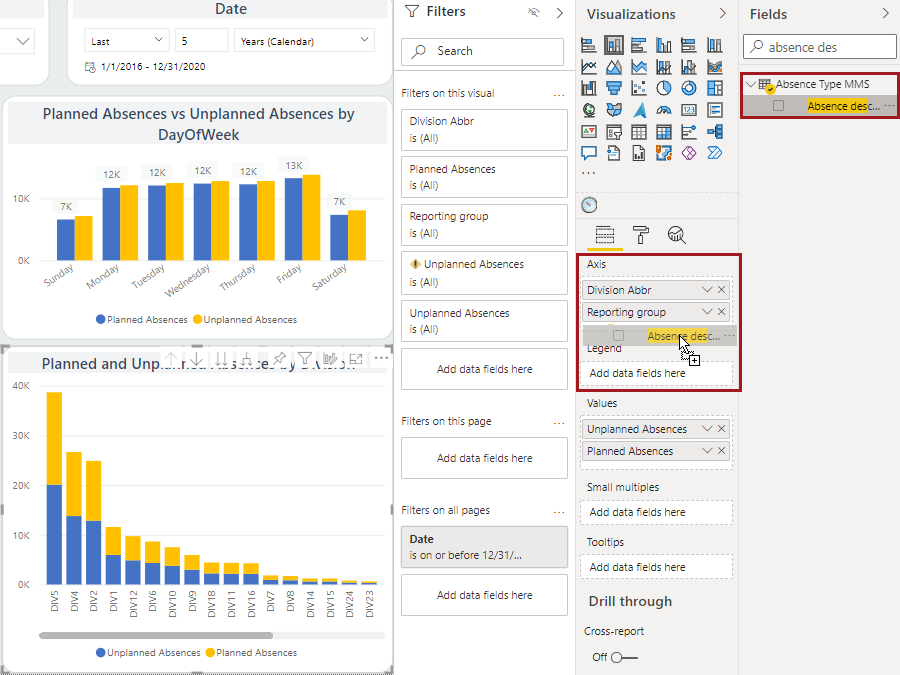
The system automatically links data where applicable and drill options are shown in the action items area. - Drag fields to be shown as the drill hierarchy values from the Fields pane to the Visualizations pane Values area.
-
To test the drill options, use the arrows in the action items area.
To.. Select this.. Drill up one level 
Drill down one level 
Then select a data point.
Select the arrow again to turn off drill down.
Expand all fields at once to add the next hierarchy to the current view 
Drill down all fields at once 