Creating and Formatting Data Slicers

Data slicers allow power users to filter data in a way that highlights specific information for consumers to see.

Data slicers are typically added at the end of the report creation process. This lets you see how data is affected after creating the slicer. Slicers also allow you to freeze data, so that not every visual is affected by the data slice.
  1. Open the report to which you want to add a data slicer.
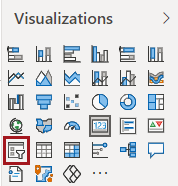
  2. In the Visualizations pane, select Slicer.
    The Visualizations pane with Slicer circled in red.
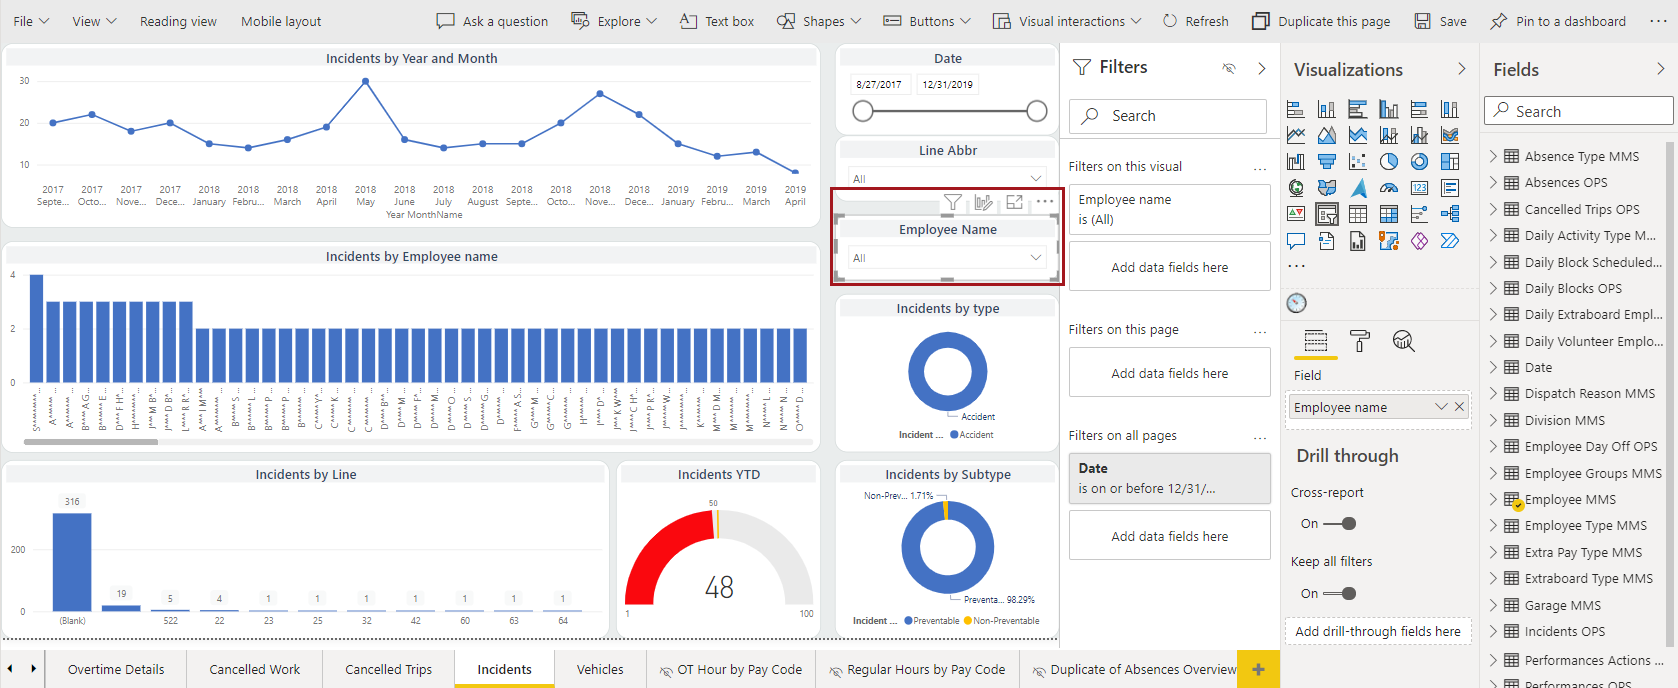
  3. In the Fields pane, Search for and select the field to use.
    Field data entries are shown in the new slicer visual. Select each entry to see how other visuals in the report are affected.
  4. Edit the canvas to include the slicer as desired.
    The report canvas with a data slicer visual circled in red.
  5. To prevent specific visuals from being affected by the slicer, do the following:
    1. Select Visual Interactions and turn on the Edit interactions toggle.
      Filter and None options should appear next to each visual. If you don't see them, select a field data entry in the slicer visual and they should appear. (The slicer visual must be selected to update the other visuals.)
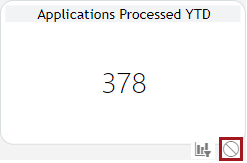
    2. On visuals to remain unchanged, select None.
      A visual showing the Filter and None options with None circled in red.
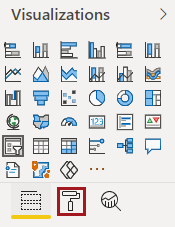
  6. To format the slicer, do the following:
    1. Select Format.
      The Visualizations pane showing the Format option circled in red.
    2. In the General section, select an Outline color and Outline weight.
    3. To allow the slicer to accommodate the report user's screen size, select Orientation Horizontal and turn on the Responsive toggle.
    4. Set the slicer size and position on the report canvas, or define it using the X Position, Y Position, Width, and Height options.
    5. Define Alt Text that describes the slicer for screen readers.
    6. Define other formatting options as desired.
      Formatting options include things like changing the slicer title and the title display color, changing the visual icon color, and defining whether certain Visual header options (action items) should be available (for example, the More options icon). Formatting can help power users make information even more accessible to consumers reading the report.