Creating and Formatting Single-Value Visuals
Visuals that highlight one data point use specific visualizations.
- Open the report to which you want to add a single-value visual.
-
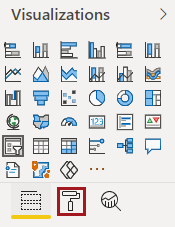
In the Visualizations pane, select one of the following:
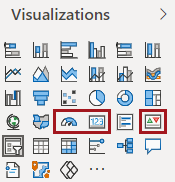
- Gauge. Shows current status compared to an end
goal.
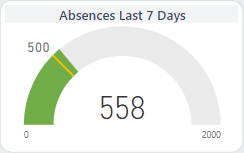
Drag fields from the Fields pane to the Value, Minimum value, Maximum value, and Target value areas in the Visualizations pane Fields area.
- Card. Shows one value.
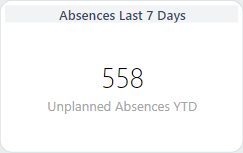
Drag a field from the Fields pane to the Visualizations pane Fields area.
- KPI. Shows current status compared to an end
goal.
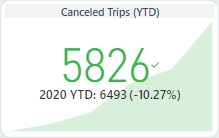
Drag fields from the Fields pane to the Indicator, Trend axis, and Target goals areas in the Visualizations pane Fields area.
Tip: You cannot sort data in KPIs. Sort data in another visualization before selecting the KPI option.
- Gauge. Shows current status compared to an end
goal.
-
To format the visual, do the following:
-
Select Format.
-
Select Format.