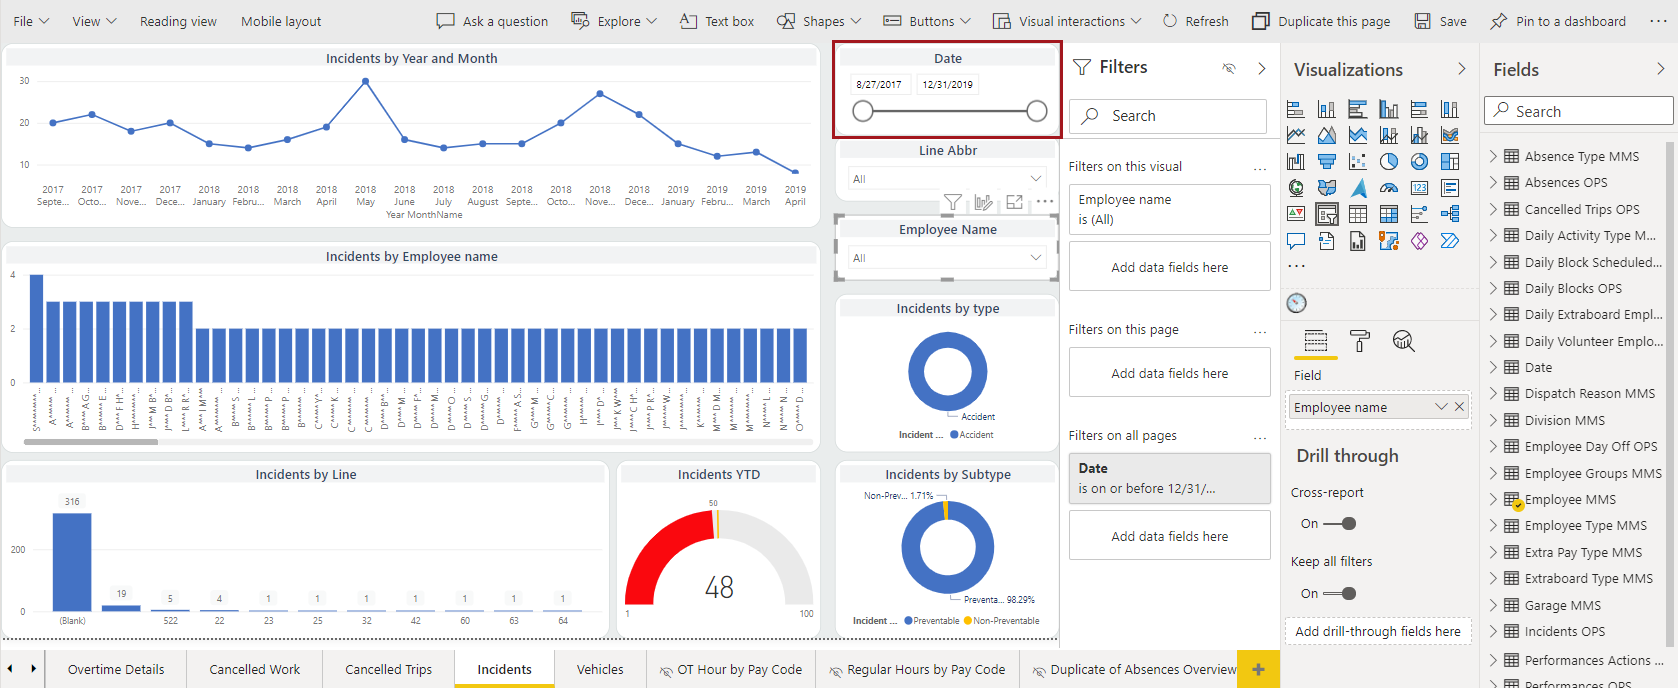
Creating and Formatting Date Slicers
Date slicers offer more choices than typical data slicers.
- Open the report to which you want to add a date slicer.
-
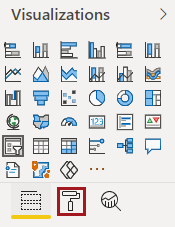
In the Visualizations pane, select
Slicer.
-
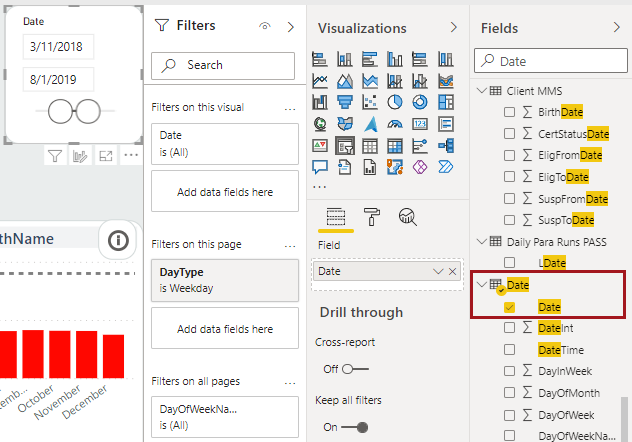
In the Fields pane, Search for and
select the Date field.
-
On the date slicer visual, select the dropdown arrow and then an option.
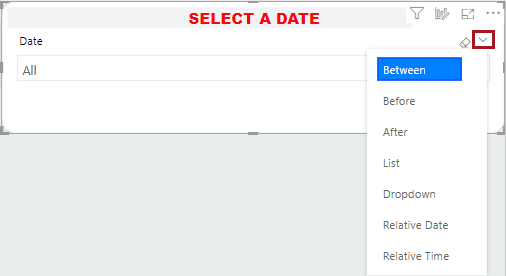
- Between. Shows from and to fields. Both can be updated.
- Before. Dims the from field. The to field can be updated
- After. Dims the to field. The from field can be updated.
- List. Dates can be selected using checkboxes.
- Dropdown. Dates can be selected using a dropdown list of checkboxes.
- Relative Date. Dates are defined based on the current date. Select Last, Next, or This; enter a number; and select the time unit to use (for example, Days or Months).
- Relative Time. Times are defined based on the current time. Select Last, Next, or This; enter a number; and select the time unit to use (Hours or Minutes).
-
If needed, you can apply filters to the date slicer visual. In the
Filters pane, select the Date
filter and then a Filter type.
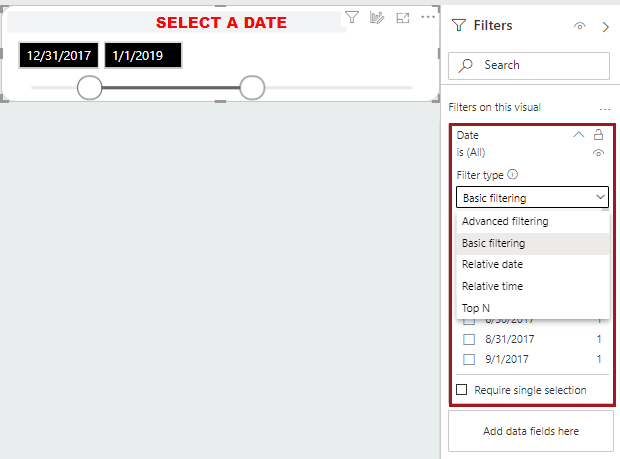
- Advanced filtering. Define the circumstances under which data should be shown. For example, when the value is before 8/1/2021 at 12:00 PM and is on or after 7/1/2021 at 12:00 PM.
- Basic filtering. Select the dates to filter by.
- Relative date. Dates are defined based on the current date. Select Last, Next, or This; enter a number; and select the date unit to use. For example, in the last seven (7) days.
- Relative time. Times are defined based on the current time. Select Last, Next, or This; enter a number; and select the time unit to use (Hours or Minutes). For example, in the next three (3) hours.
- Top N. Select Top or Bottom, enter the number (for example, three (3)), and the value to use.
-
Edit the canvas to include the slicer as desired.
-
To format the slicer, do the following:
-
Select Format.
-
Select Format.