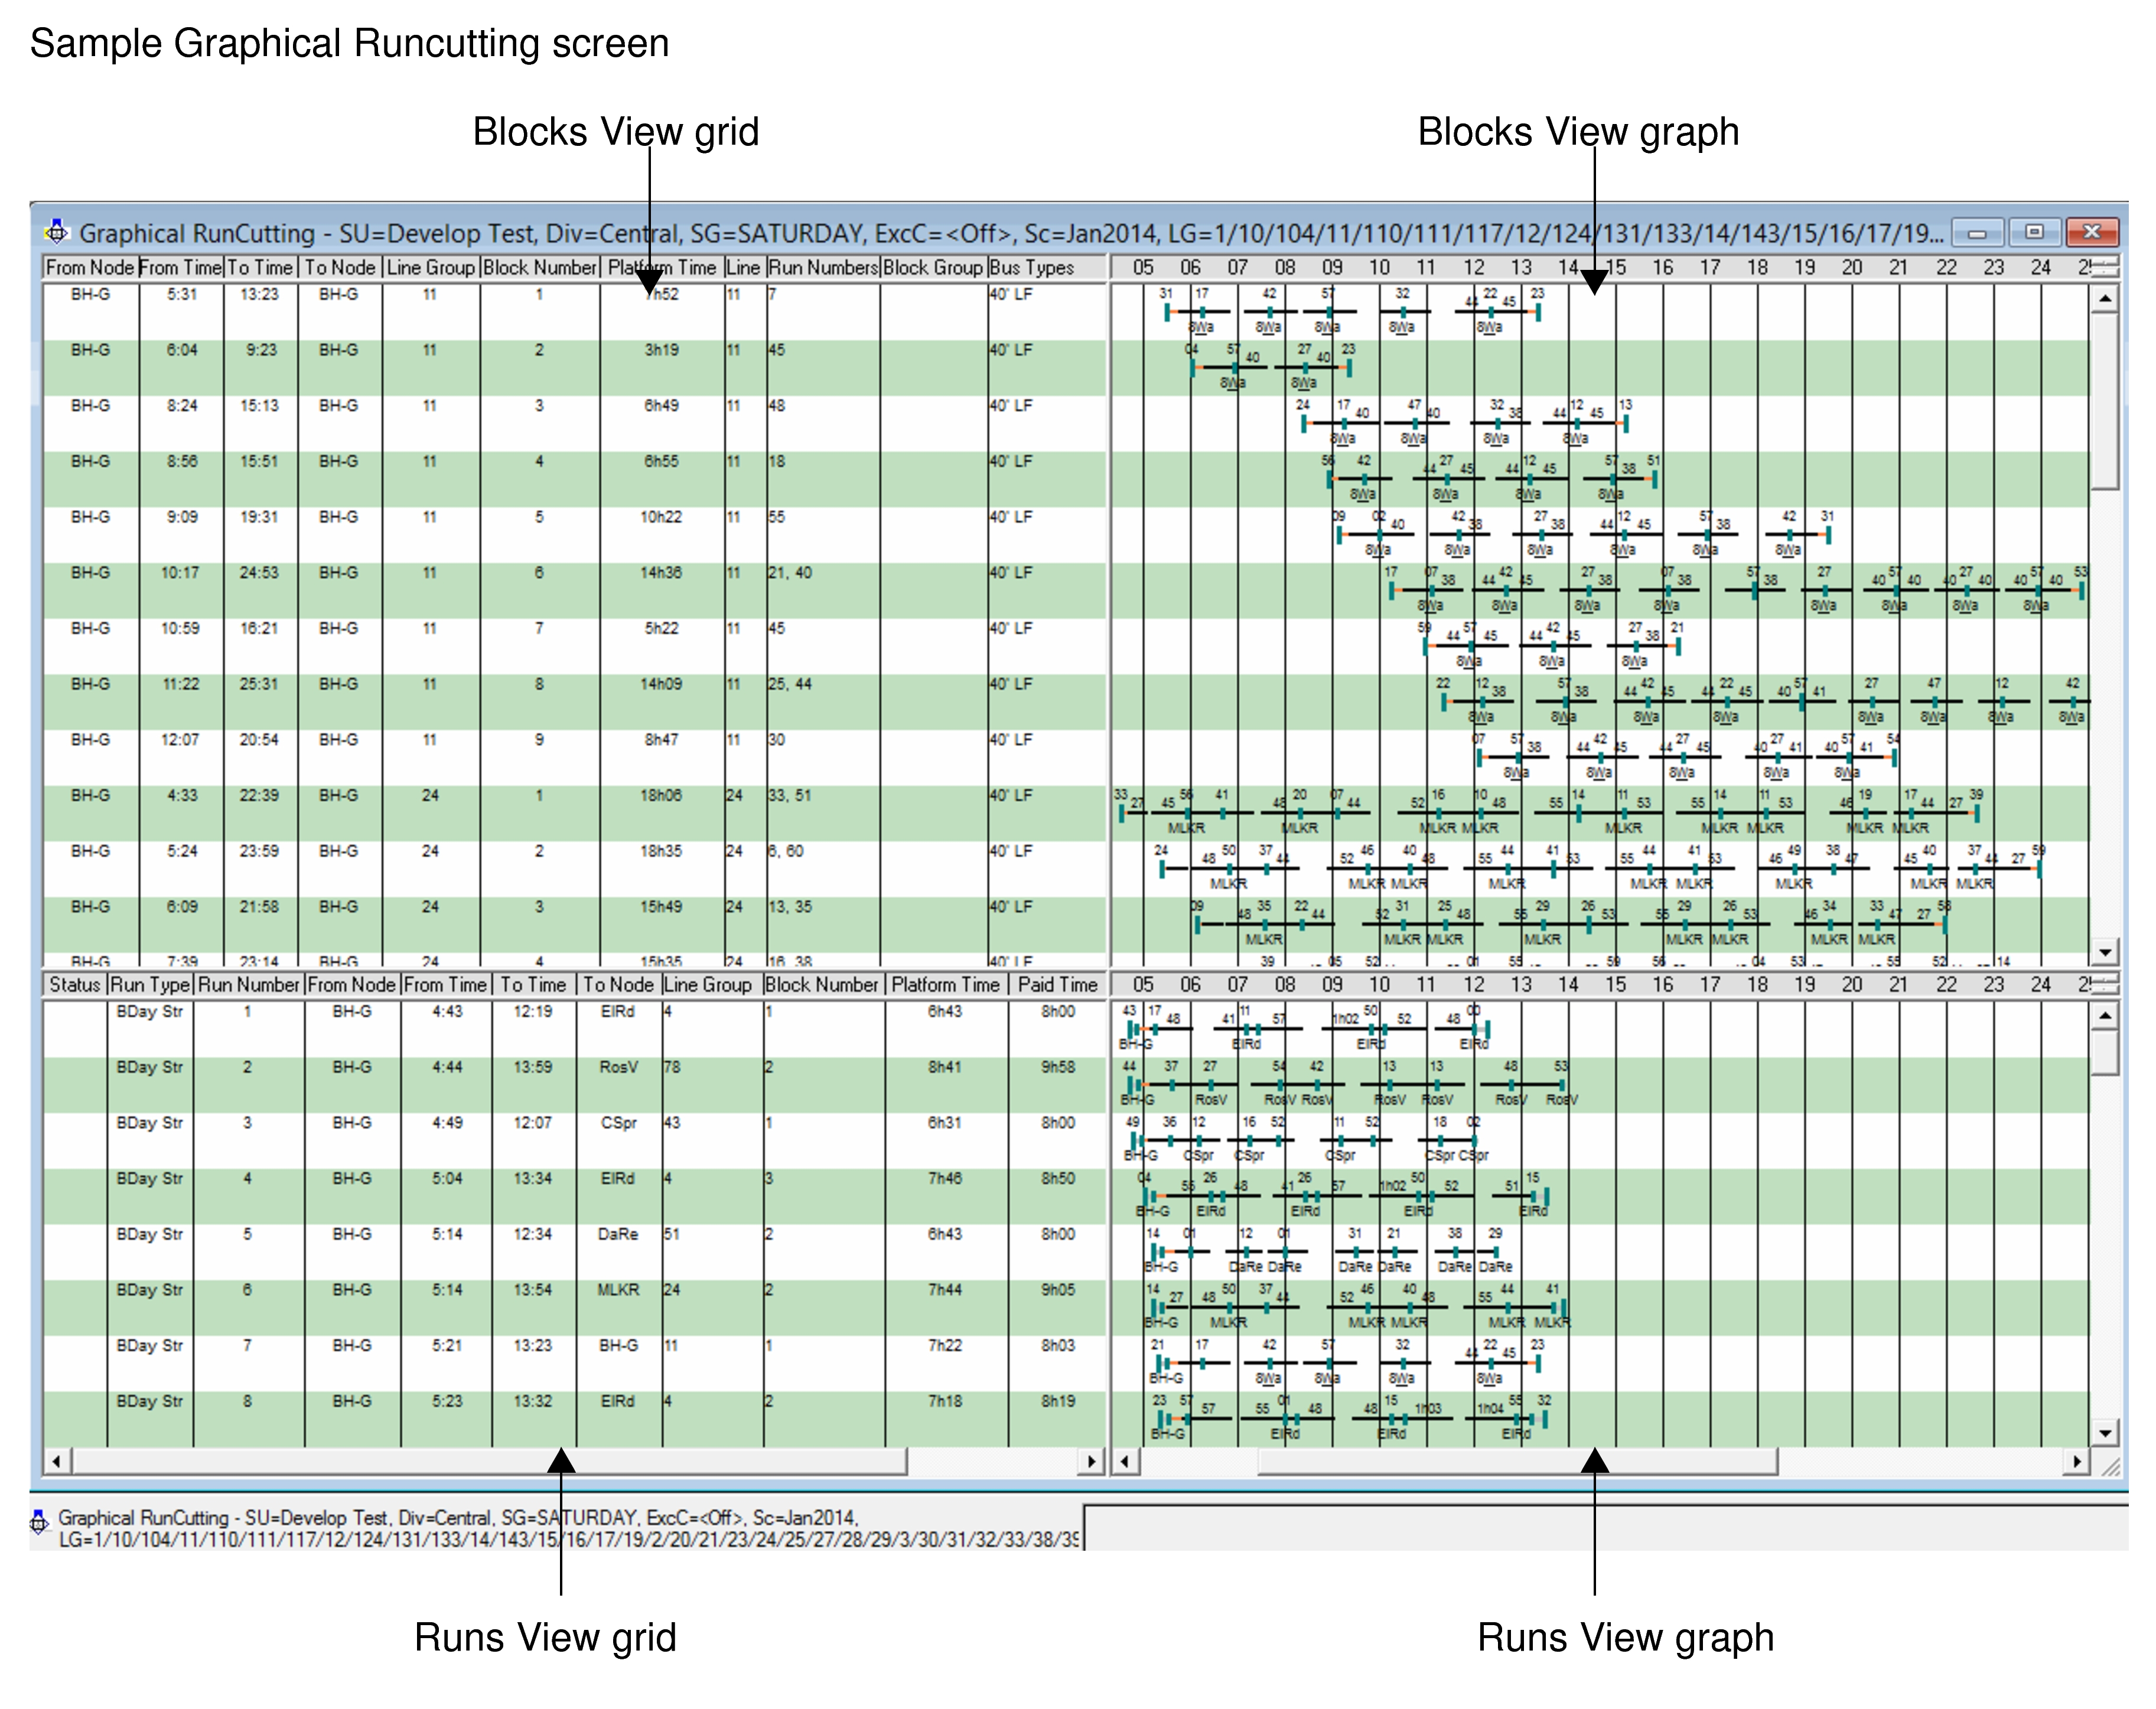
The following graphic shows the Graphical Runcutting screen with some sample
data.
The screen is divided into the top and bottom panes: Blocks View and Runs View,
with each view showing the same data in the form of a grid on the left and a graph on the right.
The appearance of the data in either view is defined in View Setup.
The following graphic shows some of the details that you can view in the graph.