Viewing Trips/Blocks Graphs
Use the Trips/Blocks Graphical Wizard screen to view the trips in detail.
-
To view the Trip graphs, click Trips on the screen toolbar:
 .
.
-
To view the Block graphs, click Blocks:
 .
.
-
Click Refresh:
 .
The trips associated with the settings you selected appear in the grids.For the trips graph, a line or two lines appear on the graph. The following graphic shows two overlapping lines which represent the trips listed on the two grids in both directions.
.
The trips associated with the settings you selected appear in the grids.For the trips graph, a line or two lines appear on the graph. The following graphic shows two overlapping lines which represent the trips listed on the two grids in both directions.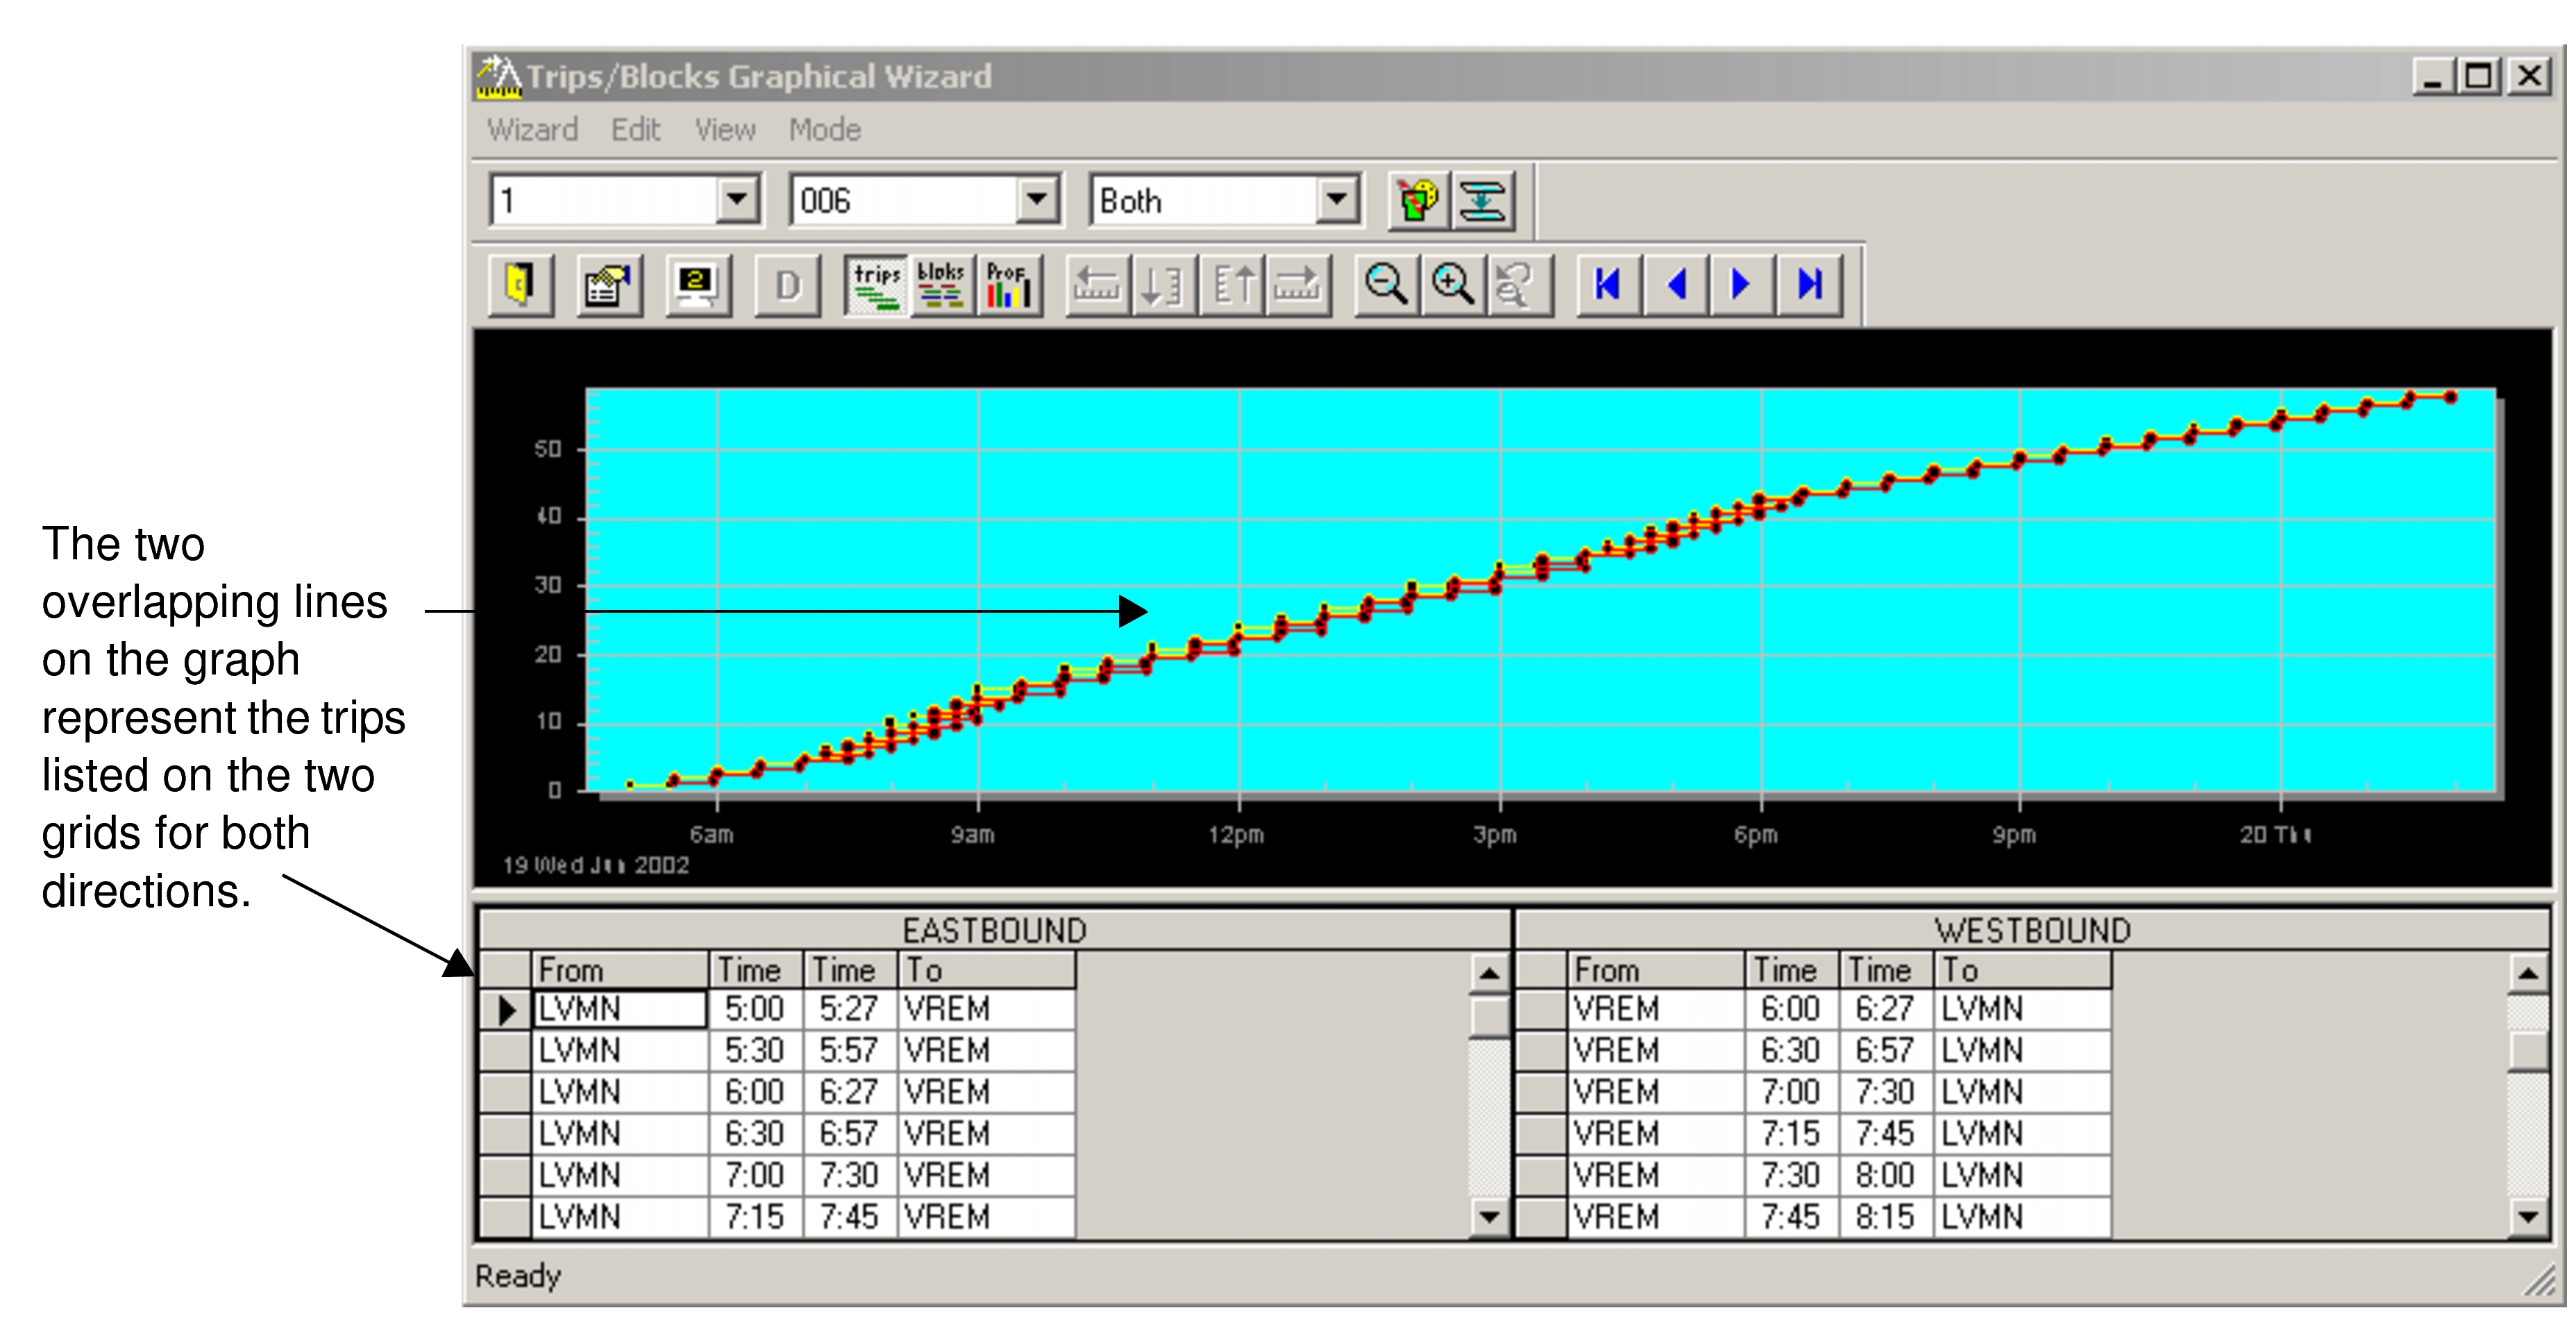 For the blocks graph, the lines are shown in separate lines with dots representing the trips. The grids on the screen show the blocks data on the left and the list of trips on the right. The following figure displays the Blocks data with the Block 1 selected. The trips data of Block 1 is displayed on the right grid.
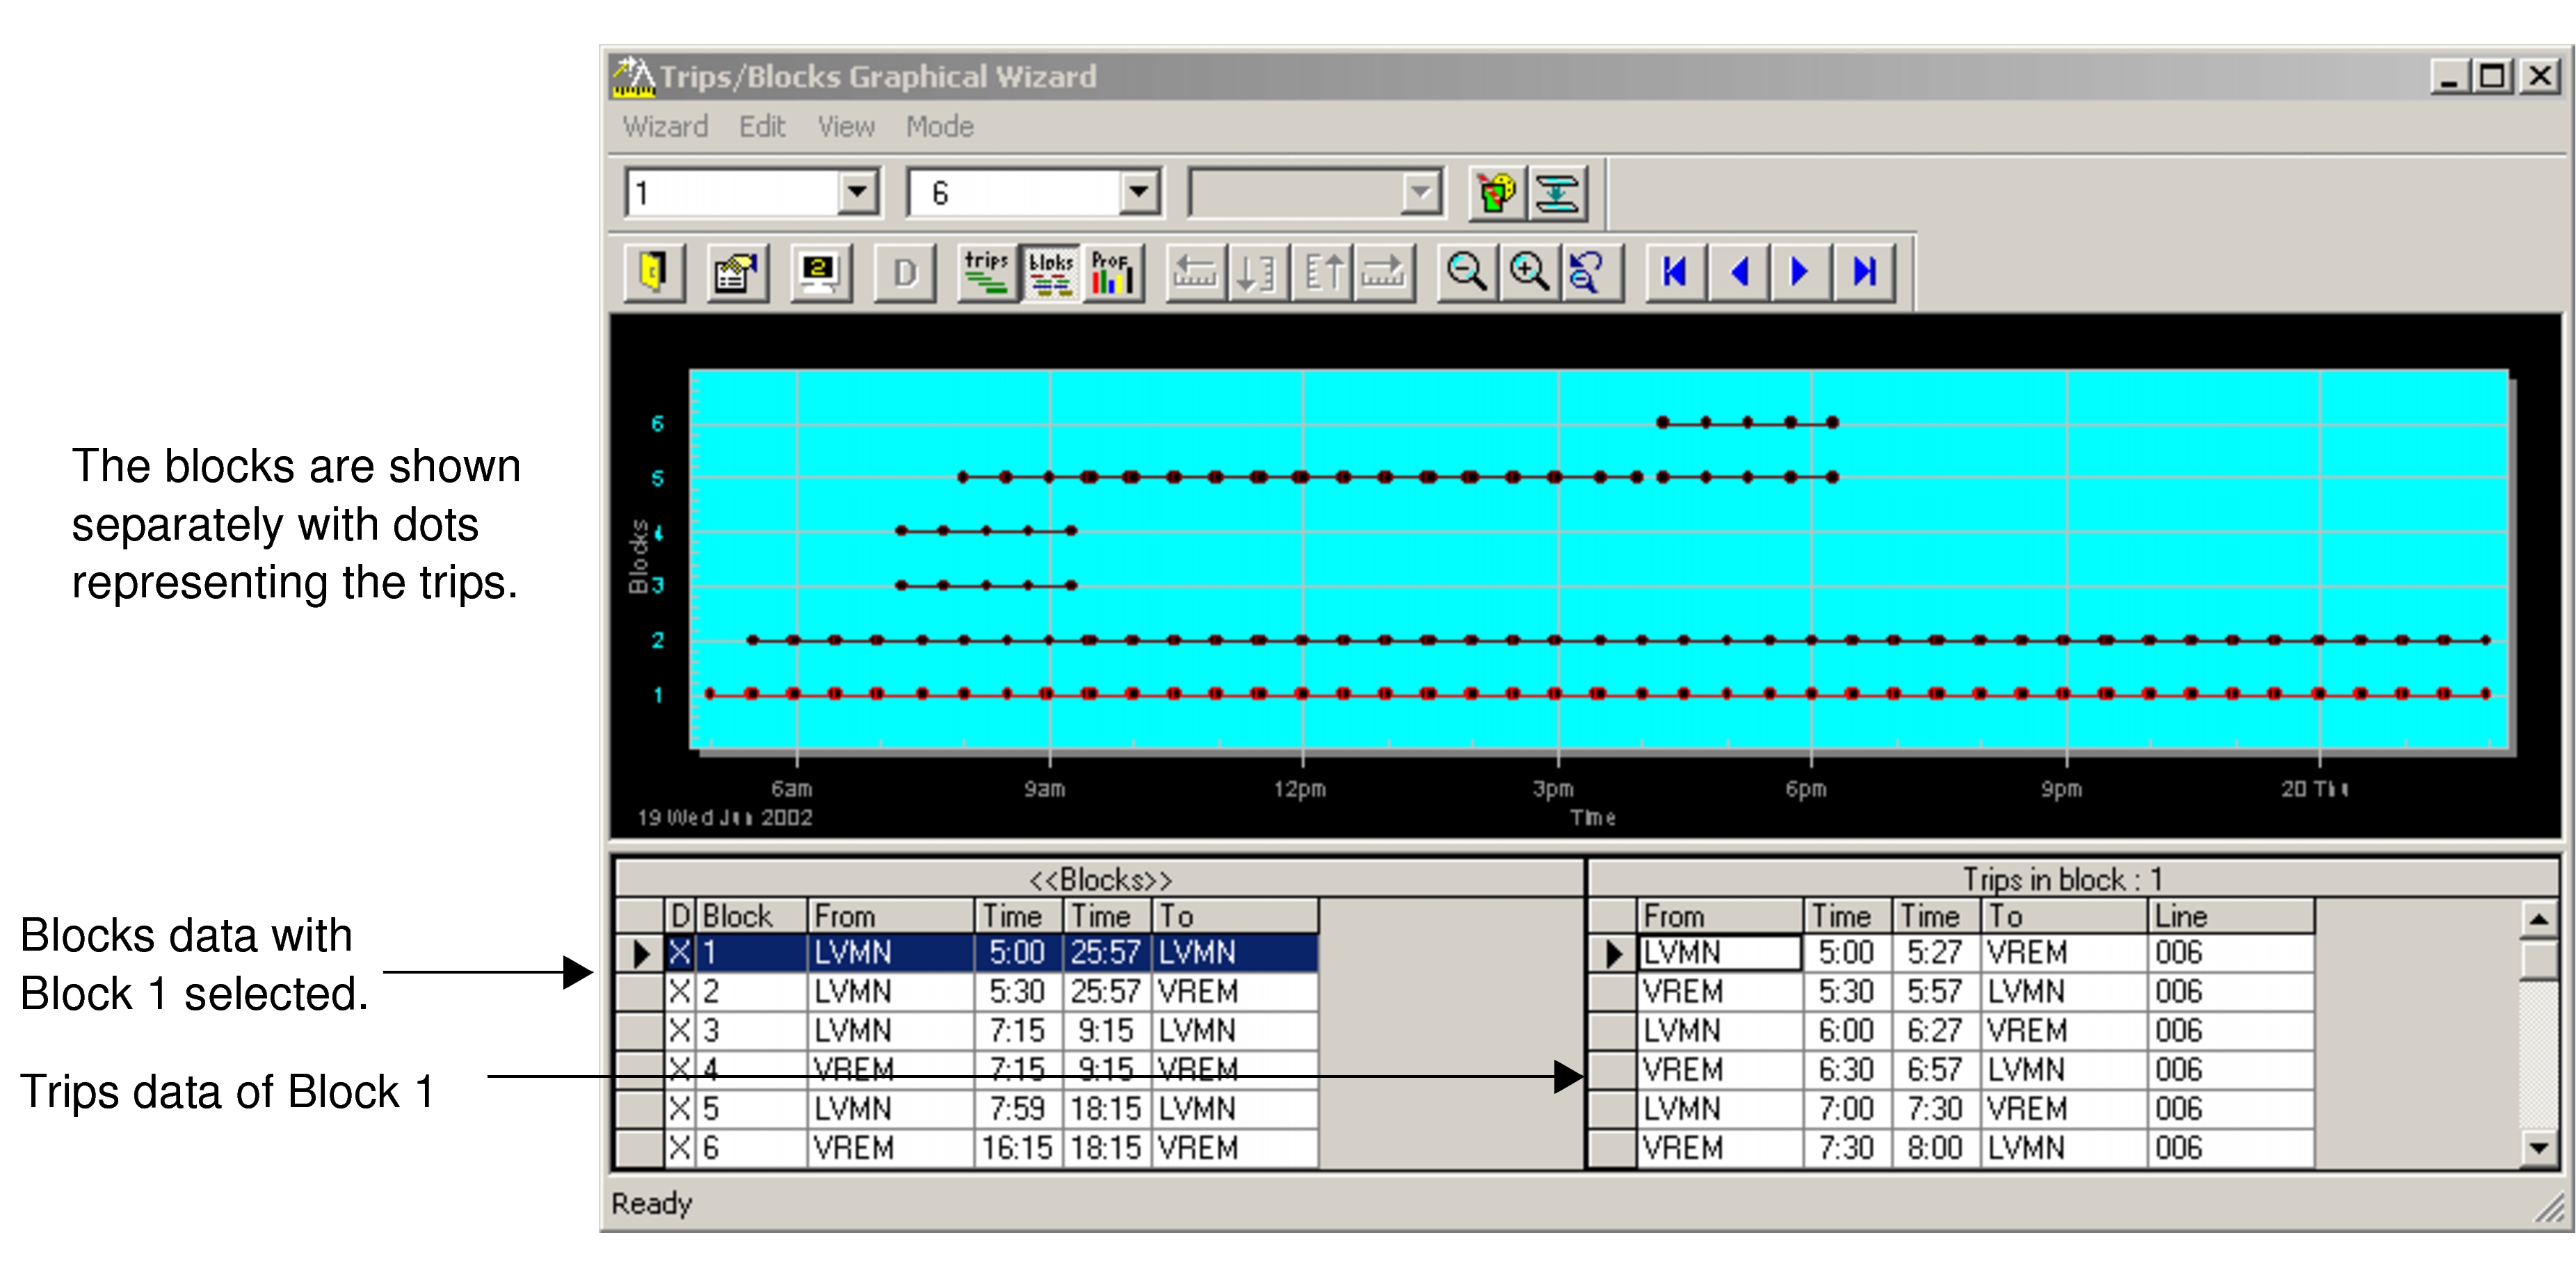
-
To view the graphs in a different format, click Mode 2:
 .
For trip graphs, the trips are shown by node by time range. For block graphs, the unblocked trips are displayed.
.
For trip graphs, the trips are shown by node by time range. For block graphs, the unblocked trips are displayed. -
Click Close:
