Place text in quotation marks for exact match search results.
Plotting Node to Node Pairs
The Plot tab allows you to calculate the distance between nodes on the system
map.
Before plotting a node to node pair, make sure that you set the
Max Dist From To Node to End of Plot property to a maximal value of
200 to get a better view of the map.
On the Node to Node tab, click the node to node pair you want to
plot.
Click the Edit button:
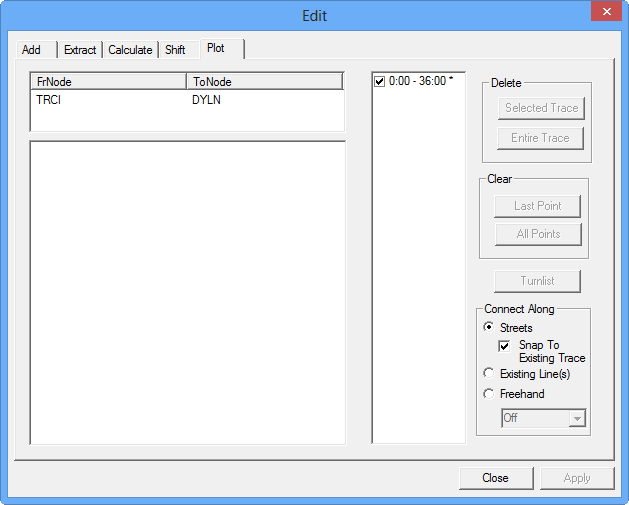
The Edit dialog box appears.
In the left frame of the Plot tab, the data of the node to
node pair you selected on the Node to Node tab appears. The run
time intervals assigned to the pair appear in the right frame. On the map, a green
square represents the start node and a red square represents the end node.
Depending on how you want the route to be connected, select the option you want to
apply in the Connect Along frame:
Streets Existing Line(s)
Freehand
If you selected Streets or
Freehand, press SHIFT and click the streets on the system map,
starting from the green square along the route to the red square. The names of the
street/intersection on each point you click on the map appear on the left frame of the
Plot tab.
Click Apply.
The plot information is saved.
To view the turn list, click Turnlist.
The Turn List dialog box appears with the plot
details.
 The Edit dialog box appears.