Pattern Screen Features
You can create as many variations of a pattern as required.
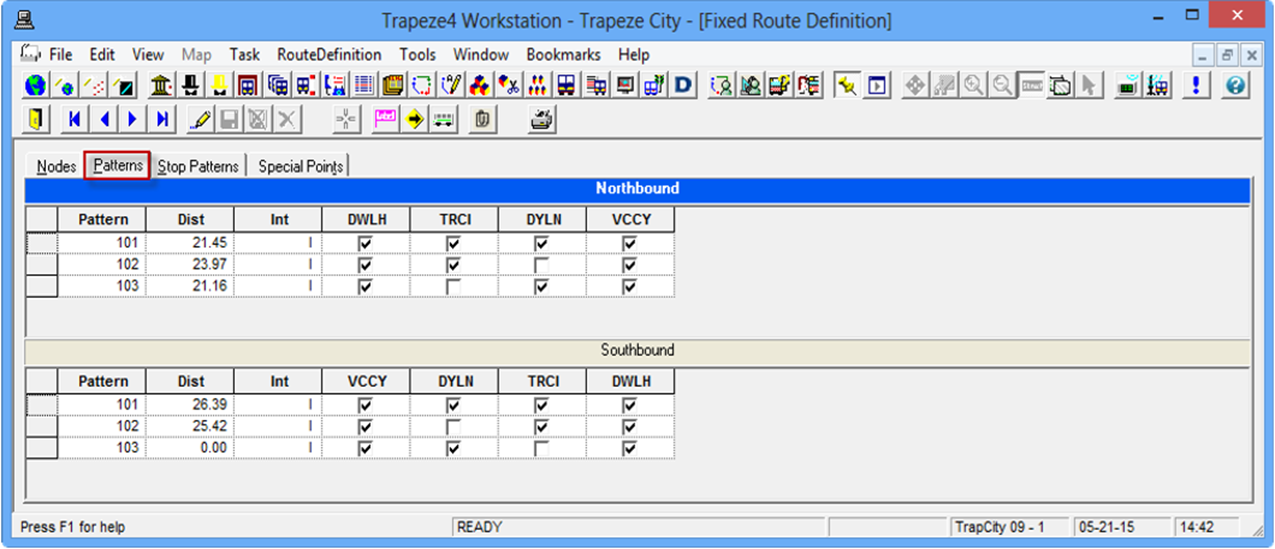
The Patterns tab is similar to the Nodes tab. It also has two grids showing the patterns for both directions. As in the Nodes tab, circular routes show only one grid.
View both grids simultaneously or if you have a large volume of data, view only one grid at a time. In the sample graphic in the previous section, note that the first direction bar, Northbound, is highlighted while the second grid is not.
To toggle between the two views, click the direction bar of the grid you want to view. It expands the grid while the second grid disappears. Clicking the direction bar again minimizes the selected grid and returns the second grid to the screen.
The Patterns grids show the following information for each pattern:
- Pattern: The name of the pattern.
- Dist: The total distance covered by the pattern is shown on the left grid. (The distances from one node to the next node in the pattern are shown in the right grid.)
- Int: Shows any of the following indicators:
- I - pattern is whole
- N - pattern is fragmented or not whole
- Comment that allows you to type comments on the selected pattern.
- Nodes: The nodes that are associated with the selected line in the current context are shown on the right grid. The nodes that are active or included in a pattern appear selected; those that are inactive or are not included in the pattern are blank.
You can adjust the width of the columns. When you add or remove a column from a grid, the system retains the width of the columns that you reset in subsequent sessions. The width of Nodes columns on the Patterns grid, however, are set back to the default because the number of nodes vary depending on the line context.
To view columns that are not within view on the screen, click the horizontal scroll bar. Only the columns that display times now move to the left or right depending on how the scroll bar is dragged. If you scroll to the right, the columns on the left remain static while the node columns, starting with the first node appear to slide under the static columns as the hidden columns are displayed.