Cross-Filtering and Cross-Highlighting
Cross-filtering and cross-highlighting options let you easily see relationships between visuals in reports.
-
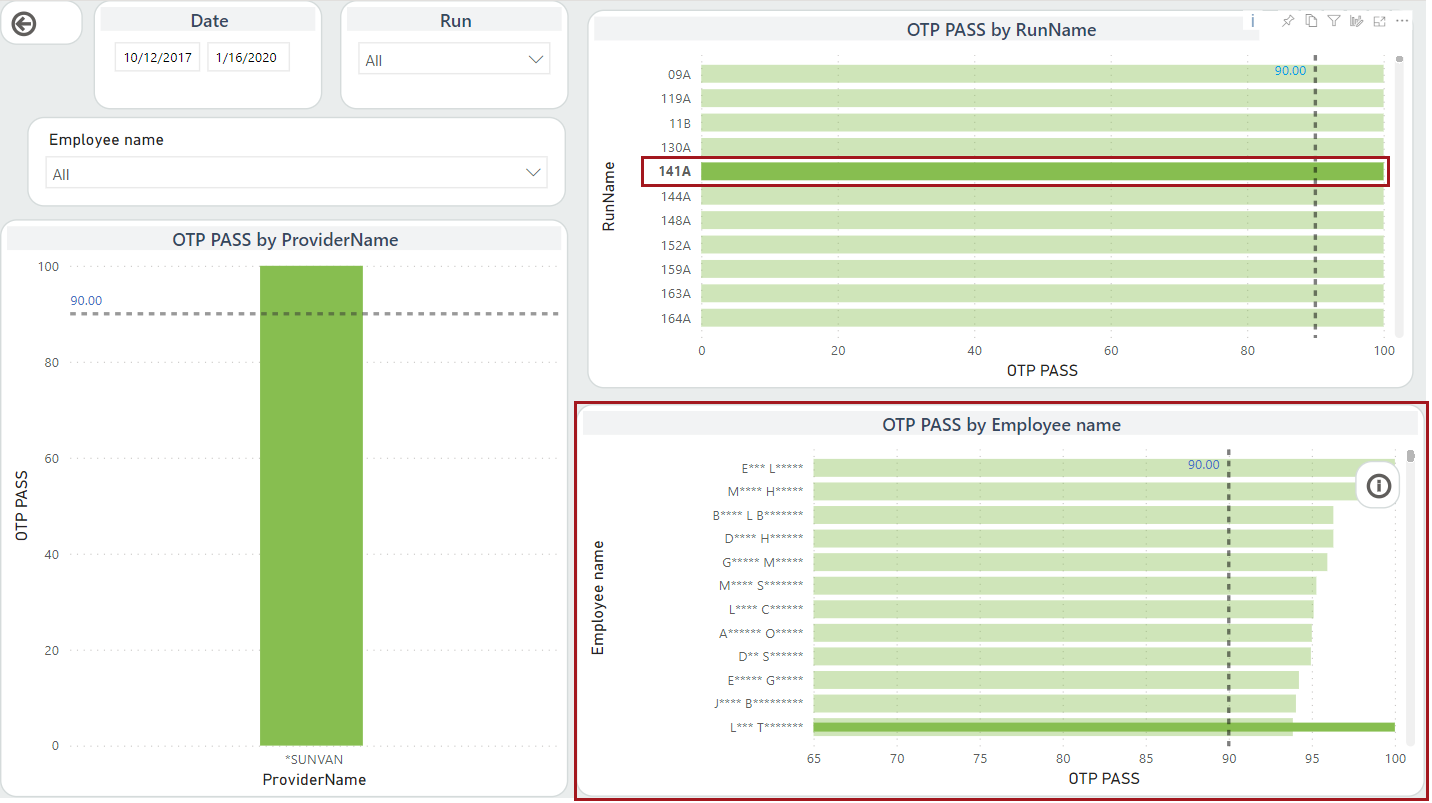
In a visual, select a data point.
Other visuals in the report are updated to show how the selected data point affects them.If cross-filtering, only the values related to the selected data point are shown. Unrelated values are removed from visuals.
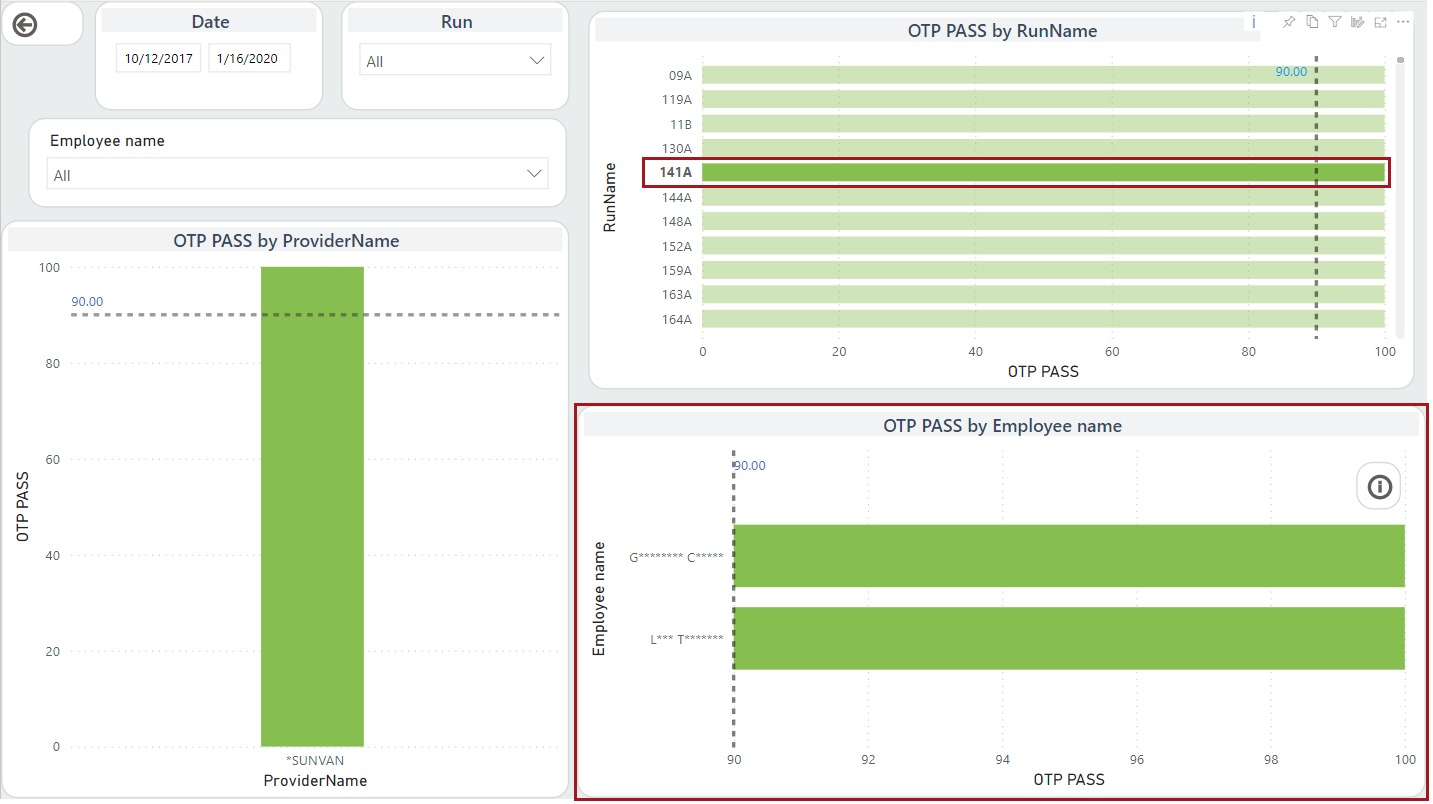
If cross-highlighting, unrelated values in visuals are dimmed.
- To stop cross-filtering or cross-highlighting, reselect the data point.