Using Visuals
Visuals show data in a variety of illustrated formats.
-
To highlight a visual on the report canvas, select .
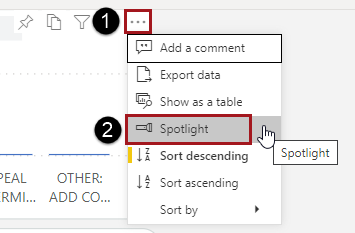
Other visuals on the report are dimmed. Hover over the visual to view details for individual data points and to access other action items.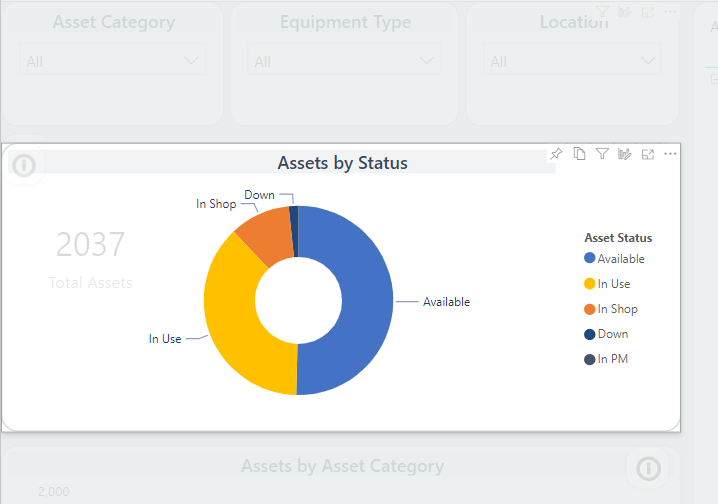
-
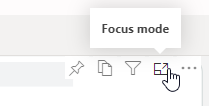
To zoom in on a visual, from the action item area, select Focus
mode.
The single visual appears on the canvas. Hover over it to view details and access the Filters pane.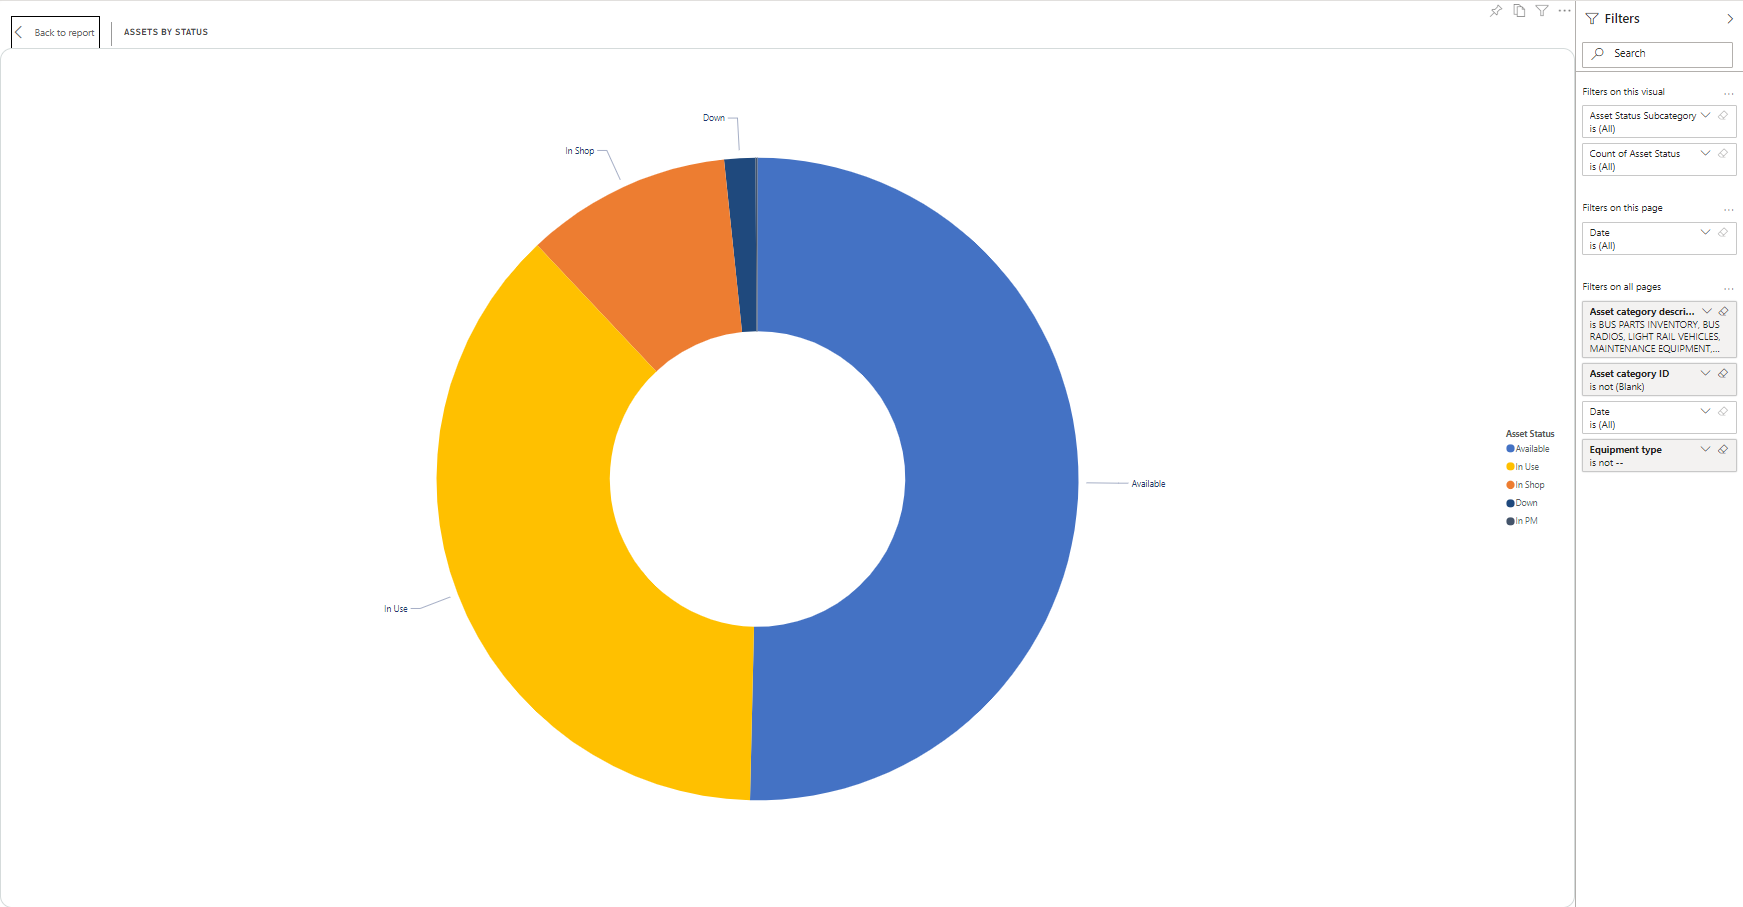
-
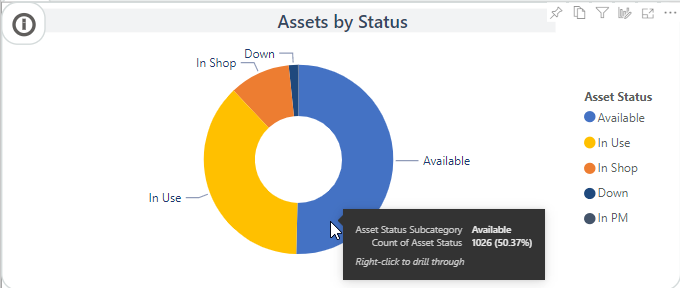
To view a tooltip of details about a visual, hover over one of its data
points.
-
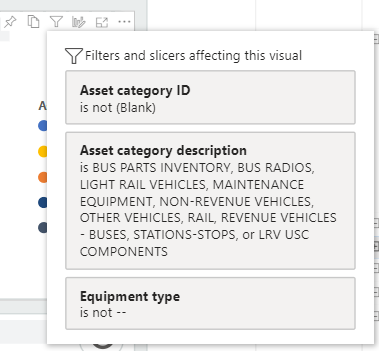
To see filters and slicers affecting the visual, hover over or select the
Filter list action item.
-
To refresh the visible data, select Refresh
visuals.

-
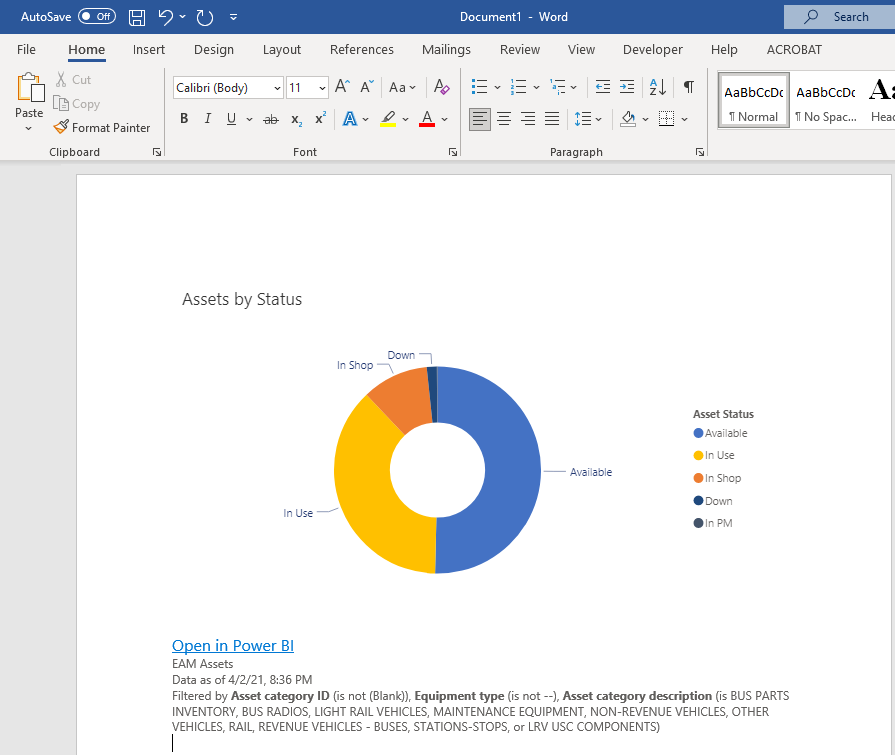
To copy a version of the visual that can be used in another application (for
example, Microsoft Word), select the Copy visual as image
action item, then select Copy to clipboard. Paste the
image into the desired application.