Viewing Data in Table Format

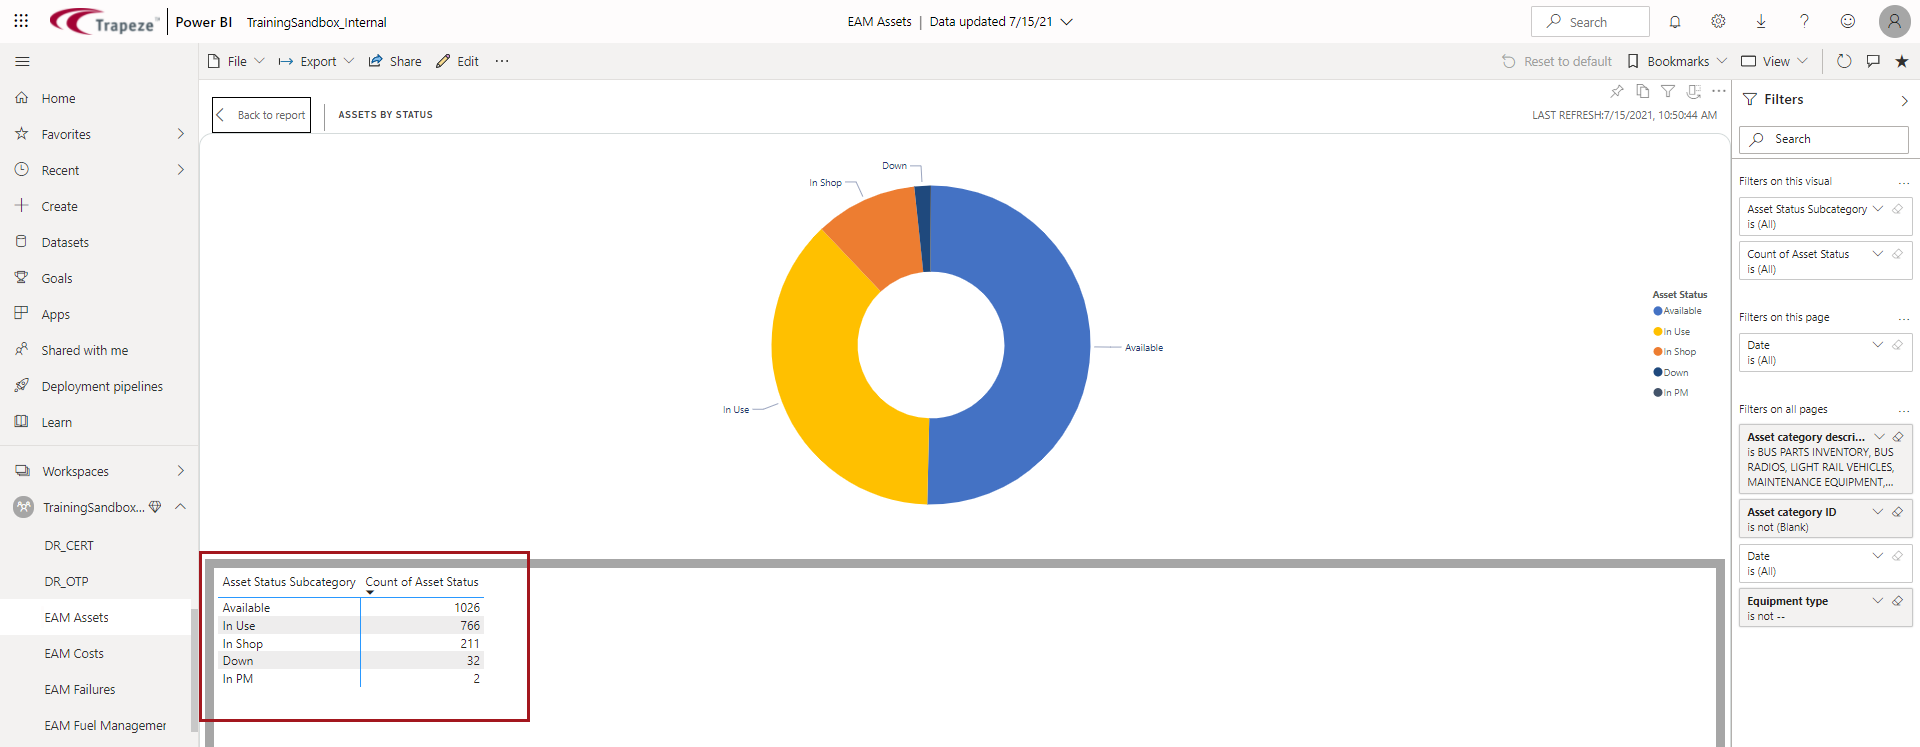
If more information is needed, data illustrated in visuals can be viewed in table format.

Depending on the data used in the visual, the Show as a table option may not be available, or it may not be useful. For example, single-data point visuals like gauges or cards.
There are several ways to view data in table format.
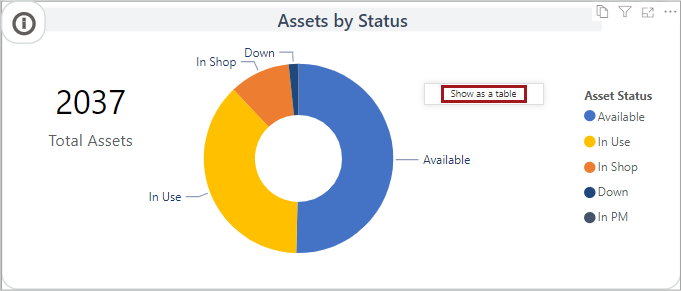
  • Right-click on a visual and select Show as a table.
    The Assets by Status visual showing the right-click Show as a table option.

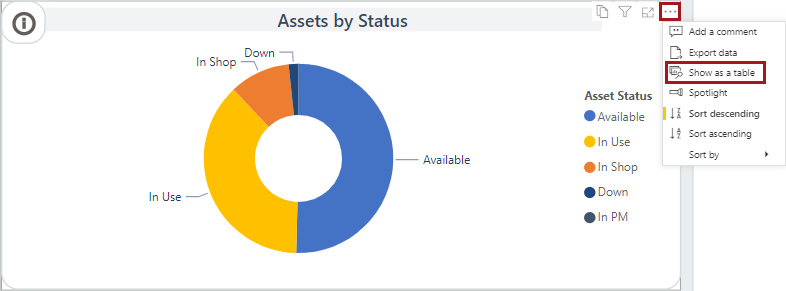
    If you right-click on a data point, you may see additional options.

  • In the action items area, select More options (…) > Show as a table.

    The Assets by Status visual showing the More options, including Add a comment, Export data, Show as a table, Spotlight, Sort Descending, Sort ascending, and Sort by.
The table opens in a new page.
Shows a table circled in red on a new page.