About Viewing Sign-Up Periods in Graphical Format
You can view all sign-up periods for all agencies in graphical format.
In the Sign-up Periods dialog box, open the
Graph tab. The graph provides the following information:
-
Each column represents a calendar year divided into 12 (monthly) subcolumns to measure the timespan of each sign-up period.
- Each row shows all sign-up periods for a specific agency. To see the exact dates for a sign-up period, place the pointer over the sign-up period on the Graph tab. Moving the pointer shows the name and from/to dates of the sign-up period.
- Areas highlighted in red show gaps of time that are not included in any sign-up
period.
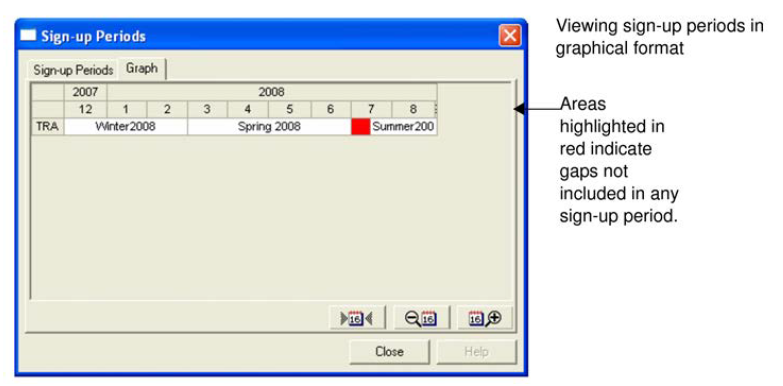
If the dates appear too close together, click either side of the dialog box and drag it to the left or right (depending on the side of you clicked) to stretch the dialog box. To adjust the date display further, click the Zoom in or Zoom out buttons at the bottom right of the dialog box.
To reset the date display, click the Reset button (before the Zoom in button).