BlockBuster provides histograms (or run graphs) of work content and platform time for a
runcut.
To access the histograms associated with a runcut that is open on your screen, click BlockBuster > Histograms or click the Histogram button:
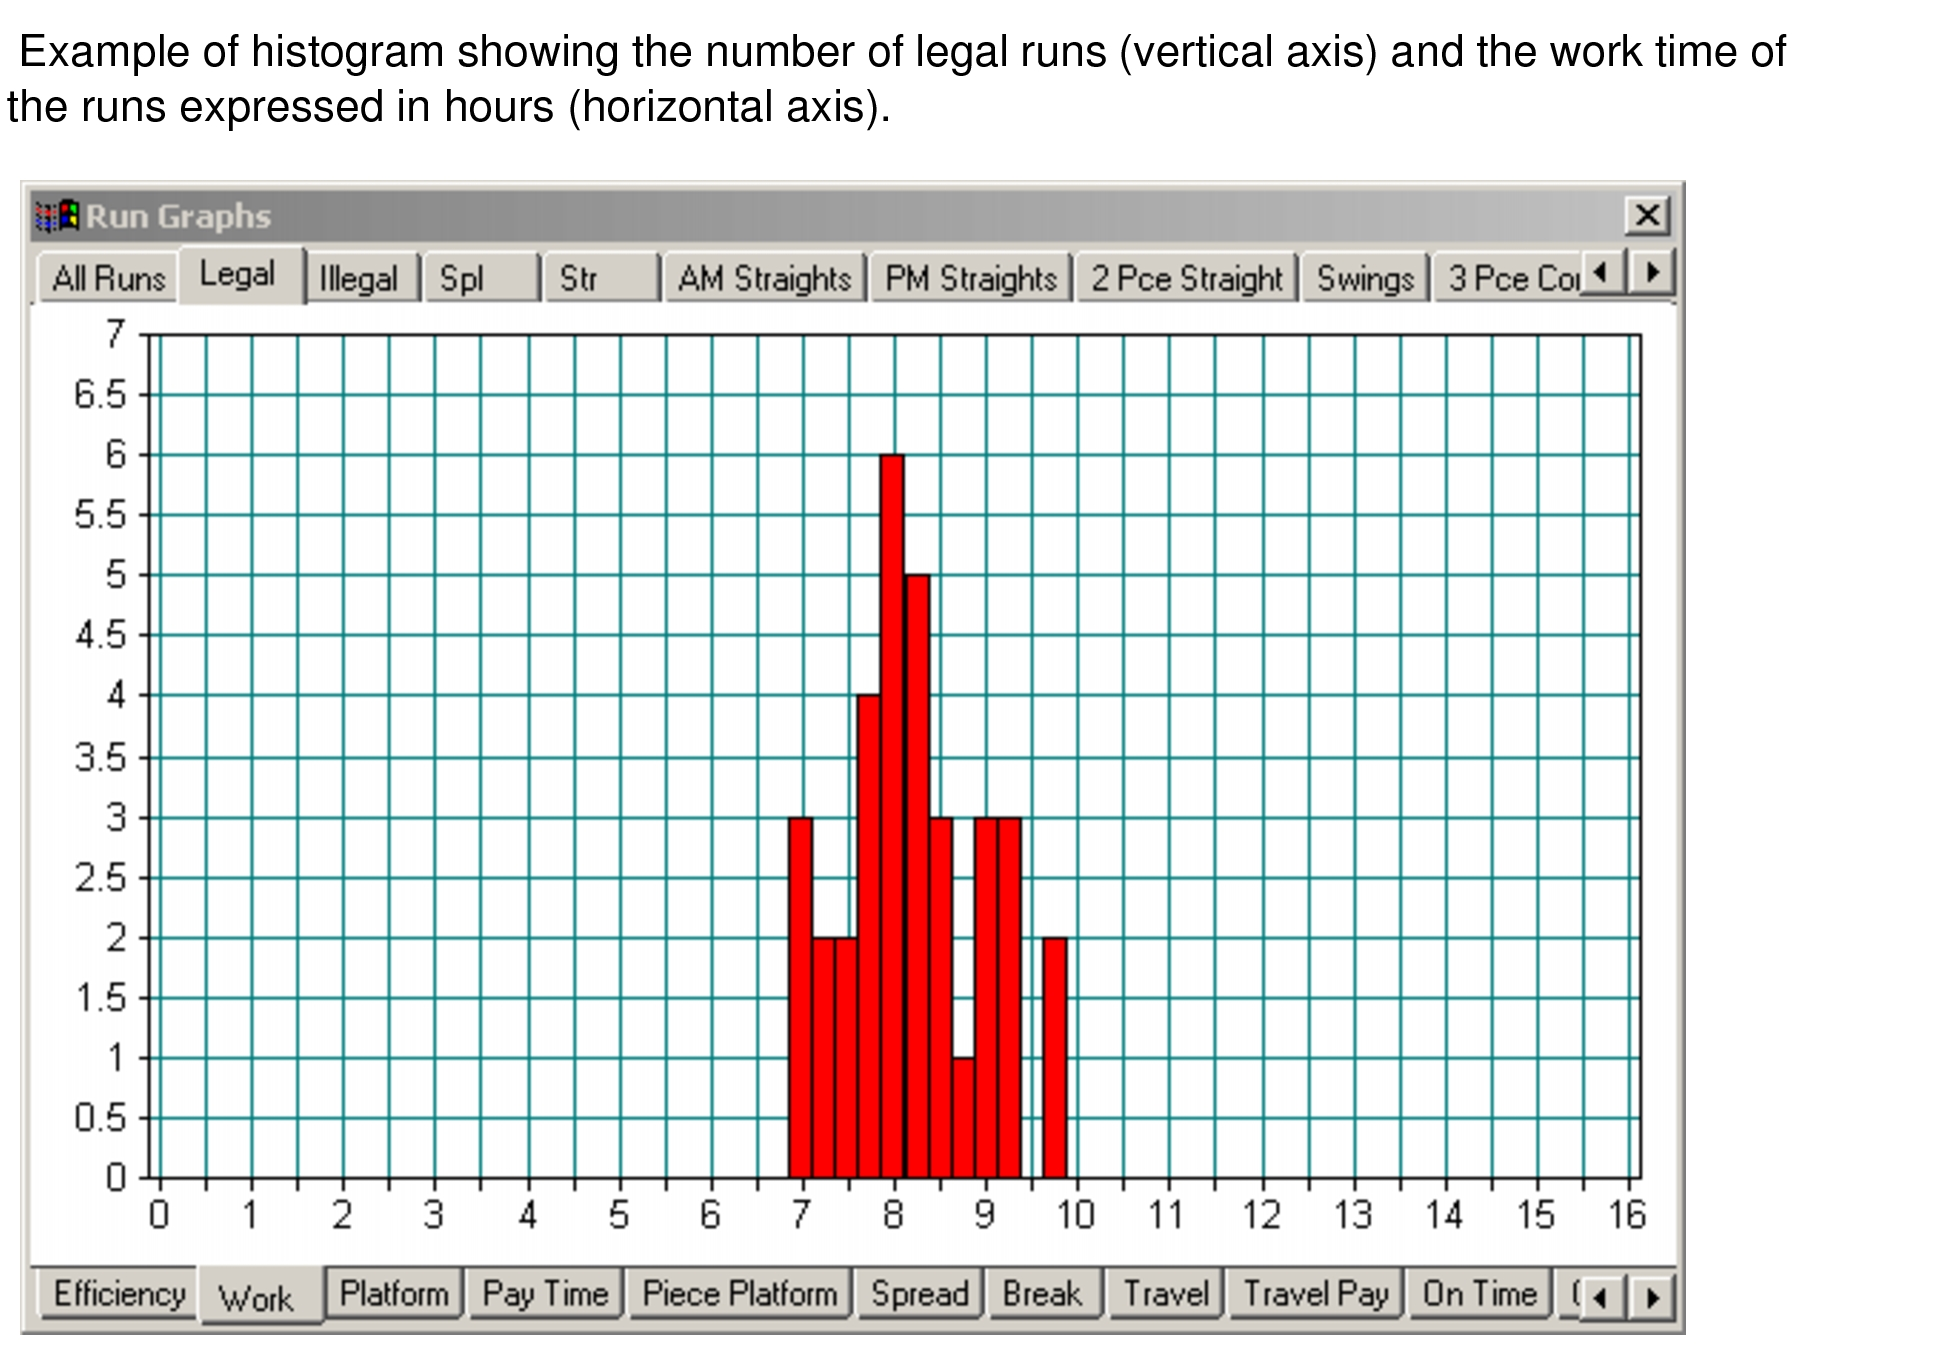
The histogram appears. The x-axis (horizontal) illustrates the items on the
lower tabs while the y-axis (vertical) represents those on the upper tabs. The following
example shows thenumber of legal runs (vertical axis) and the work time of the runs
expressed in hours (horizontal axis).