Place text in quotation marks for exact match search results.
Viewing Check Data on the Graph Tab
You can create a graph of ride check and point check data that has been collected for one or more trips.
Click Task > Ridership Analysis.
The Ridership Analysis screen appears.
On the Trips tab, do one of the following steps:
To view ride check data based on the Board, Alight, Load, click Ridership > Show and choose the Board, Alight, Load option.
Then, select a node column header or a row marker of a trip.
To view ride check data, click Ridership > Show, and choose the Time Difference option and then,
select a node column header or a row marker of a trip.
To view point check data, with the Ridership Analysis screen
in point check mode, select the row marker of two or more trips.
To view point check data, with the Ridership Analysis screen
in point check mode, select the Actual,
Diff, or Dwell column headers. Make sure
to select only one of these columns to display on time performance data; selecting more
than one displays passenger activity data.
Note: Make sure that you select a trip that contains check data. Look for trips marked
Yes in the Chk column.
Open the Graph tab.
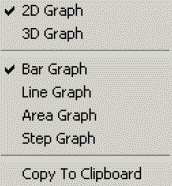
By default, the graph tab displays a two-dimensional (2D) bar
graph.
Optional: To choose another type of graph, right-click the graph and choose the dimensional
display (2D or 3D) and type of graph (bar, line, area, or step) from the right-click
menu.
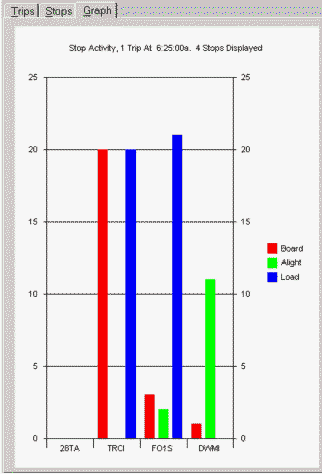
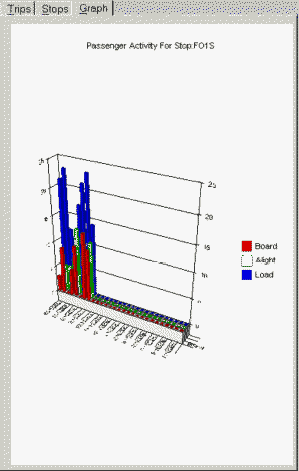
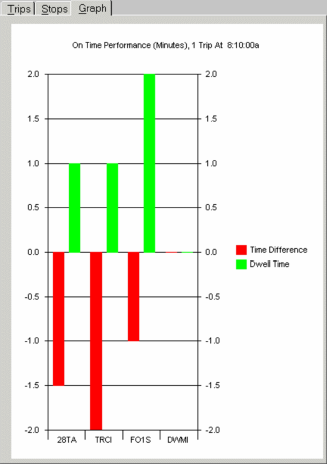
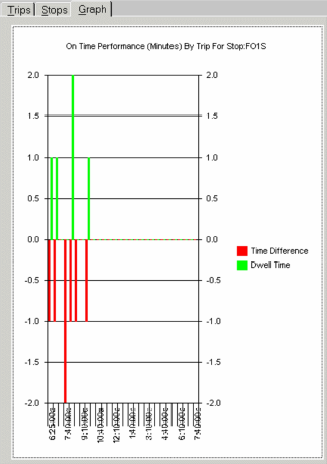
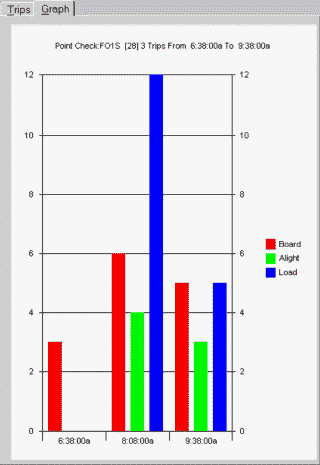
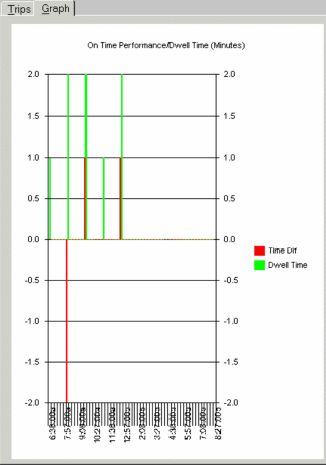
The check data of the selected trips appears in graphical
format. The following figures show graphs of passenger activity and on time performance data
for ride checks and point checks.
Graph tab showing passenger activity data from ride checks
Passenger activity across multiple nodes
Passenger activity across time at one node
Graph tab showing on time performance data from ride checks
On time performance across one trip (row)
On time performance across time for one node (column)