About Bus Graphs
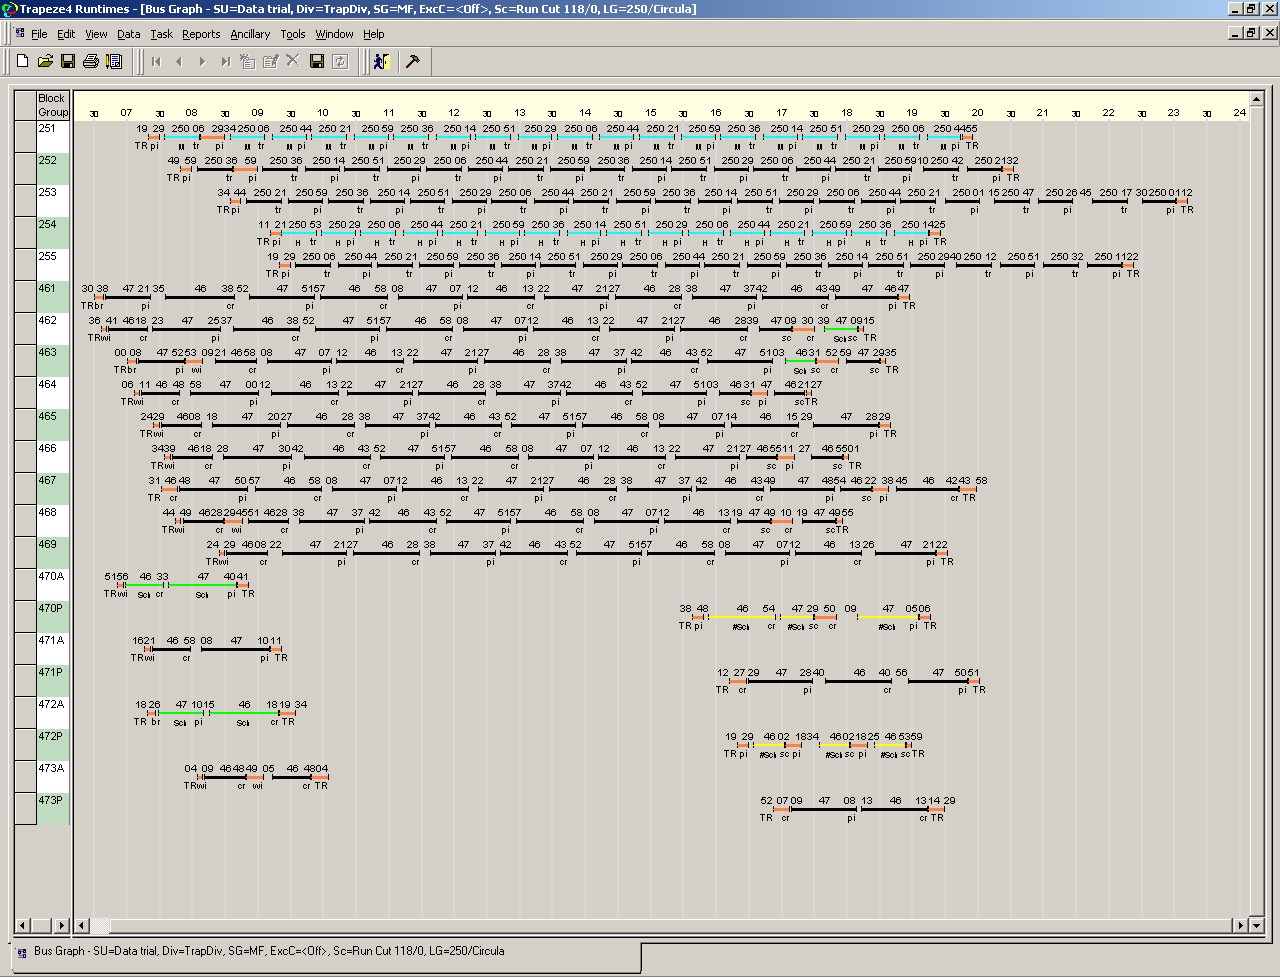
Bus graphs are graphical representations of vehicle and driver blocks.
Bus graphs can be described as an electronic version of the graphs that schedulers traditionally prepared when plotting blocks on graph paper. They are graphical aids for schedulers who prefer to view trips on a graph rather than on a list in the Blocking screen in Trapeze FX. They help make it easier to spot the effect of minor changes to trips and blocks, for example, if you reschedule a trip 5 minutes later, you can determine if the block has enough layover time before the next scheduled trip.
To choose the columns you want to display, click or right-click on the left grid. From the shortcut menu, click Customize. The Customize dialog appears.