Adjusting the Size of Timelines
The timelines are the lines on the graph that represent the pieces of blocks and runs on the graphs pane.
To adjust their size, click Graphical Runcutting >
Time Line and any of the following options:
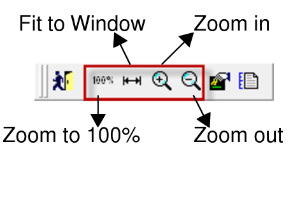
- Zoom in: To see a more detailed view of the timelines.
- Zoom in fine: To see a more detailed view of the timelines with the percentage of enlargement in smaller increments.
- Zoom out: To see a broader view of the timelines.
- Zoom out fine: To see a broader view of the timelines with the percentage of reduction in smaller increments.
- Zoom to 100%: To restore the view to the zoom value set as the default.
- Fit to Window : To see the entire graph sized proportionally within the window.
Some of these options are also available within the screen toolbar.