If you want to show a visual image of scheduled runs, you can show them on a graph.
Before you begin
Schedule Editor must be open.
About this task
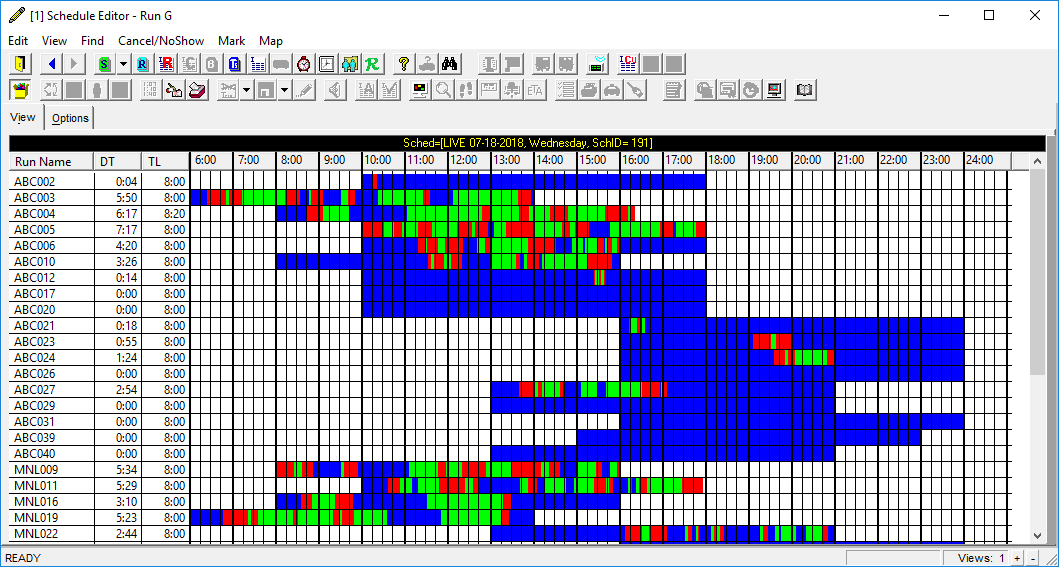
Each segment of each scheduled run is shown to the minute and
appears in a specific color. The run segments are overlaid with lines that mark every quarter
hour. Drive Time (DT) and Total Length (TL) are shown in columns on the left side of the
screen.
Procedure
- Optional:
Change the colors shown in the Run Graphical view:
-
Click .
-
Click the Tools tab.
-
Click .
-
Click a color for each of the following properties:
-
- Break Time Color
- The break time.
-
- DH Time Color
- The time between pull out and pick-up.
-
- Slack Time Color
- The slack times at the beginning and end of the run.
-
- Transport Time Color
- The time there is one or more passengers on the vehicle.
-
Click the Run Graphical View button:

The runs appear in graphical view.
- Optional:
Select a run and double-click on it.
Run Itinerary view opens to the selected run's itinerary.