Setting the Layout
Setting the layout of the grid and bus graph refers to defining the time span of the runs, time interval, and field lengths shown on the screen.
-
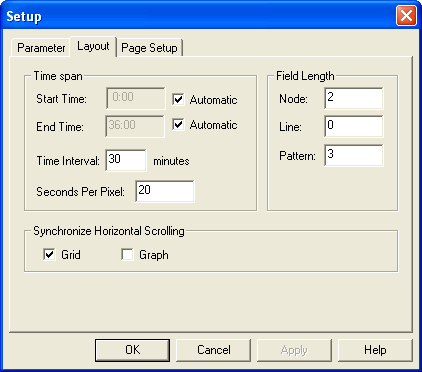
On the Setup dialog, click the Layout
tab:
-
To adjust the visible width of the graph to match the
earliest and latest times of day, select the Automatic check boxes in
the Time span frame. (These are selected
by default.)
To set definite times, clear the check boxes and type times in the Start Time and End Time fields.
- To alter the times in the header, type the appropriate time in the Time Interval field. For example, if you type “10”, the header displays ten minute intervals, for example,00, 10, 20, 30, 40, 50, and so on. If you type “20”, the header displays time intervals of 00, 20, 40, and so on.
- To set the size of the bus graph displayed on the screen, type an appropriate value in the Seconds per Pixel field. A small number such as 10 will show the graph zoomed out showing the whole day. A large number such as 60 will show the graph zoomed in with only a small section of the graph visible. The bus graph reverts to this zoom level when it is opened.
- In the Field Length frame, set the number of characters for the Node abbreviation, Line abbreviation, and Pattern name you want displayed on the screen.
- To apply the settings to the graph, select the Graph option in the Synchronize Horizontal Scrolling frame. (The Grid option is selected by default.)
- Click Apply.
- Click OK.