Plotting Polygons
After you have determined the colors and patterns of a polygon, plot the polygon on the map.
Before you begin
About this task
Procedure
- Click .
- Click a polygon type in the list
- Click the polygon to map.
-
Click the Edit button:

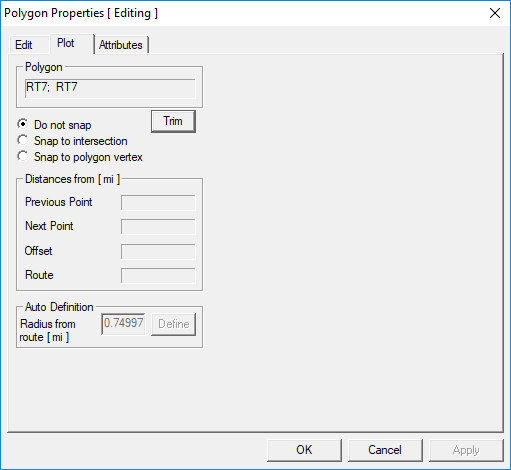
The Polygon Properties dialog box appears. -
Click the Plot tab.
-
Do one of the following:
To Do this Plot points to snap to the closest intersection or the end of the segment Select Snap to intersection. Plot points to snap to the existing polygon vertex Select Snap to polygon vertex. Perform a more flexible freehand plot Select Do not snap. - Move your pointer over the map.
-
Press the SHIFT key and click the areas, one at a time, where
you want to plot a point.
The points you plot connect to form an enclosed polygon.
- When the polygon is complete, click Apply.