About the OPS Spatial Analysis Screen
Locations where accidents and incidents occurred can be viewed on a map in the OPS Spatial Analysis screen.
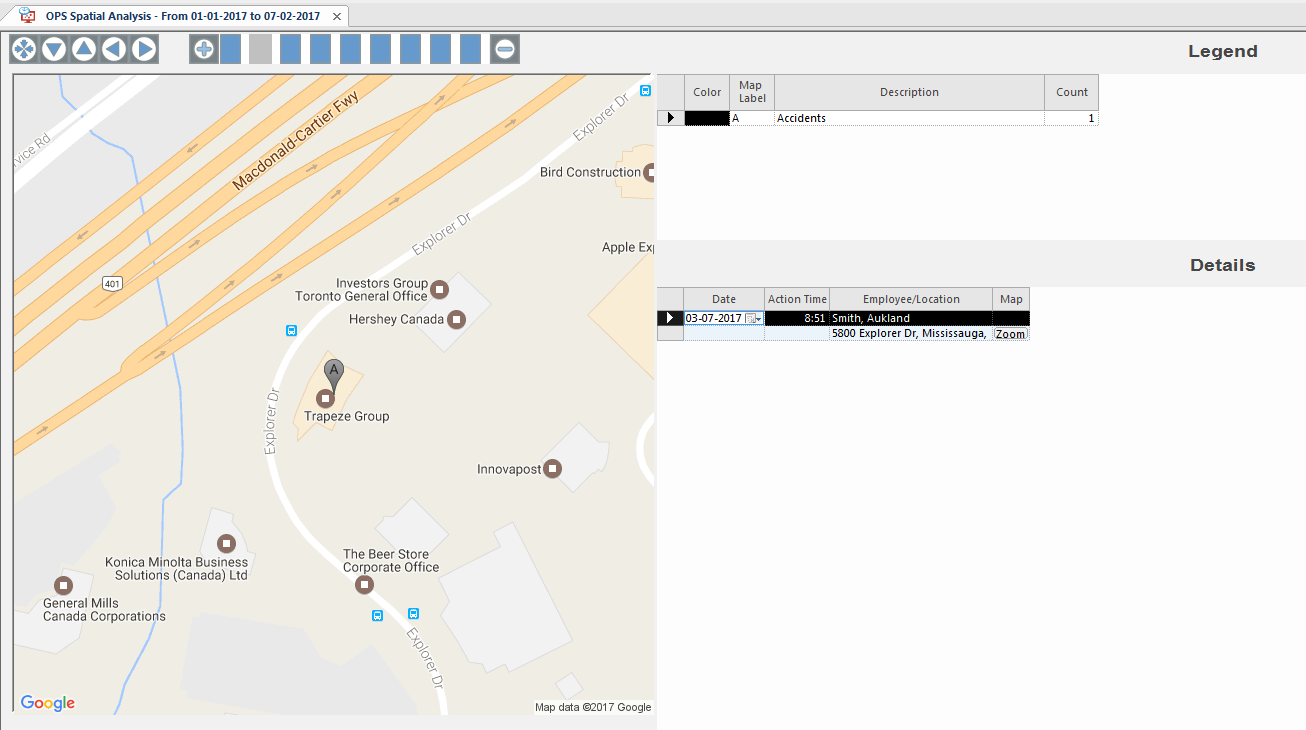
A dot or marker appears in the location of each accident or incident. The Legend pane shows the type of accident or incident that each dot or indicator represents, and shows the number of accidents and incidents of each type on the map. The color and label for each accident or incident type is specified in ancillary data.
You can view all accident and incident locations on the map, or view the locations of specific accidents and incidents. Accident and incident types must be associated with reporting groups in ancillary data for their locations to appear on the OPS Spatial Analysis screen map.