Generating Absence Charts
Generate a graphical version of statistical data from the Personnel tab of the OPS Statistics screen.
- Open the OPS Statistics screen and set the Context (F3).
- Select the Personnel tab.
-
Select Show Chart:
 The code at the side of the chart specifies which colors represent which absence types.
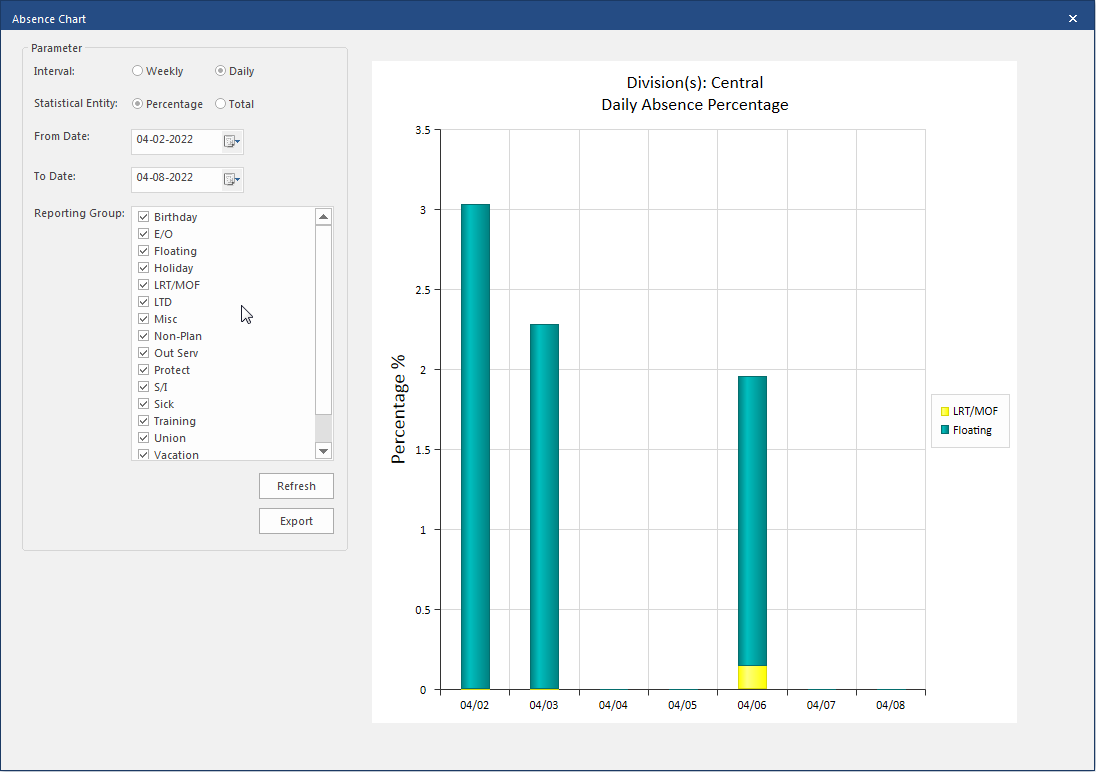
- After changing parameters, select Refresh to see the changes.
- Select Weekly to see bar graphs for absences grouped by work weeks.
- Select Daily to see bar graphs for absences grouped by day.
- Select Percentage to see absences calculated as a percentage of total absences.
- Select Total to see absences presented as the total number of person days absent.
- Change the From Date to alter the range of data displayed.
- Select the Reporting Group(s) for which to see absence information.
- Hover over the colored sections of the bar graph for details.
- Optional: Select Export to save a copy of the graph in JPG format.