Generating Volunteer Usage Graphs
Generate a graphical representation of volunteer usage from the Volunteer Usage tab of the OPS Statistics screen.
- Open the OPS Statistics screen and set the Context (F3).
- Select the Volunteer Usage tab.
-
Select Show Chart:
 The code at the right of the chart specifies which colors represent which days.
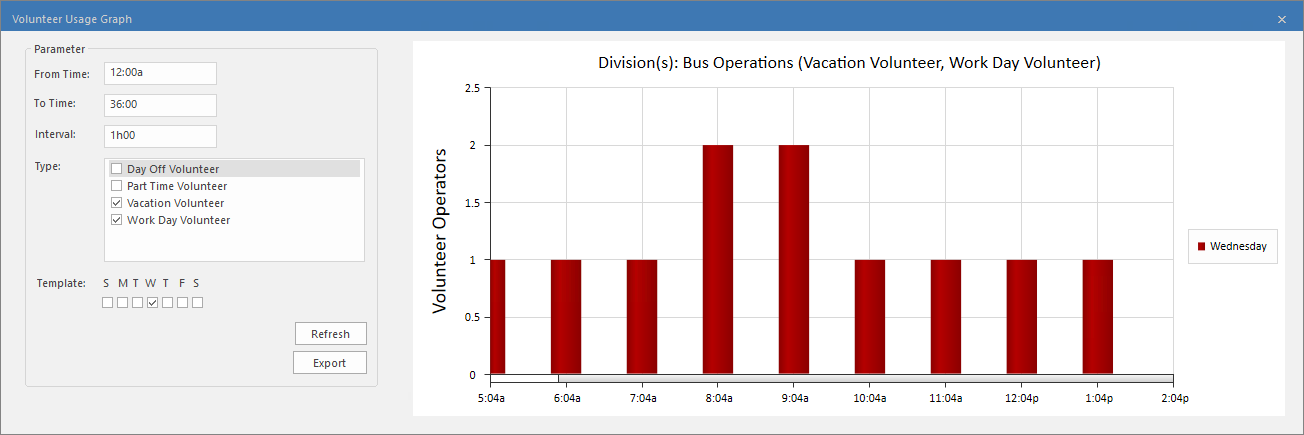
- After changing parameters, select Refresh to see the changes.
-
Set the From Time and To
Time.
These are the hours you want charted for each day in the work week determined by the Context. For example, if you enter 6 and 24, you would see utilization from 6∶00 AM to midnight.
-
Enter an Interval.
The interval length determines how data is grouped. For example, if you entered 2 you would see data in two hour segments.
- Select the volunteer Type(s) to be graphed.
- Select the days to be graphed in the Template.
- Optional: Select Export to save a copy of the graph in JPG format.