About the Vehicle Requirements Chart
The Vehicle Requirements chart shows vehicle requirements and availability at different times during a day.
The chart uses the date defined Vehicle Assignment screen Context, and is based on the schedule and number of vehicles assigned for the day.
You can specify the times and vehicle types included in the chart.
By default, the chart shows the number of vehicles of each type required at particular times of the day. Peak requirement times and numbers of vehicles appear at the top of the chart.
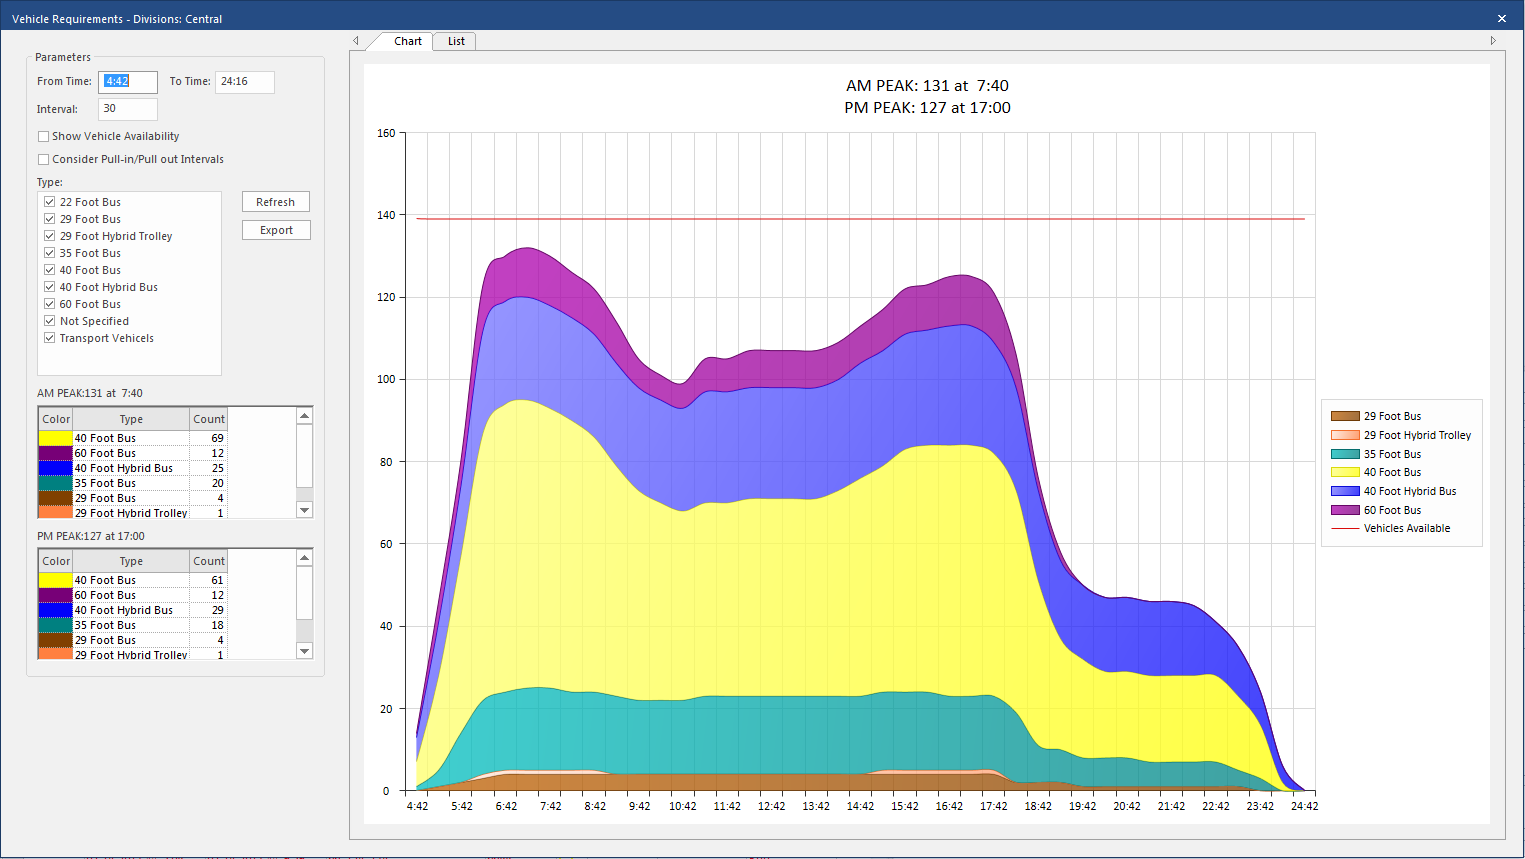
Alternatively, you can show the numbers of available and required vehicles to see whether enough vehicles are available to meet the required number of vehicles.
The bottom of the chart (the X‑axis) shows times during the day. You can specify the time range and intervals to show on the chart. The values along the left side of the chart (the Y-axis) indicate the number of vehicles that are required or available.
You can also export the vehicle chart as a .jpg image for use in other applications.
| Action | Details |
|---|---|
| Viewing the Vehicle Chart | Select Show Vehicle Chart. |
| Specifying the Chart's Time Range |
Do one of the following:
|
| Adjusting the Chart Time Increment |
|
| Specifying Vehicle Types to Chart |
|
| Showing Required and Available Vehicles |
|
| Exporting the Vehicle Chart |
To export the vehicle chart as a .jpg file:
|