About Dispatch Manager
Dispatch Manager combines features of Dispatch with elements of real-time PASS operational data.
This screen consolidates information about the service day from various areas of the Trapeze4 Workstation and presents it in an integrated interface. You can also customize this screen to suit your dispatching needs.
There are two main areas in Dispatch Manager:
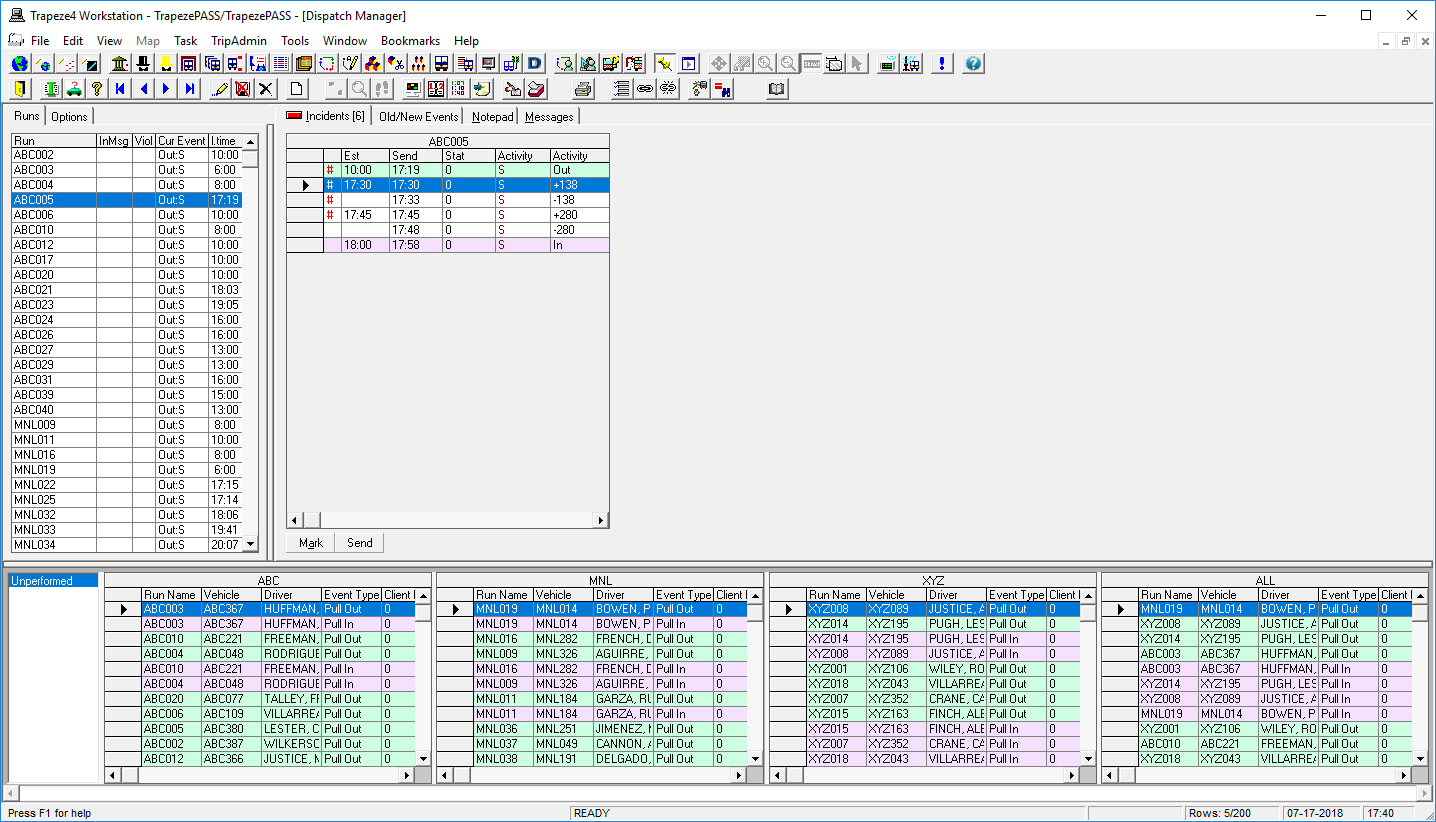
- The upper panes, which are used to view alerts for incidents, violations, and incoming messages.
- The lower pane, which is used for real time views.
Perform the following tasks in the upper panes:
- On the Runs tab, view details for the day’s runs, including violations.
- Sort the runs by clicking column headers. For example, click Viol to move runs with violations to the top or bottom of the grid.
- Selecting a run on the Runs tab shows more detailed information on the Incidents tab.
- On the Options tab, use filters to refine the list of runs shown on the Runs tab.
- On the Incidents tab, look for events that require your
attention. To show information about the selected event on the map, open the map and click the Display button:

- On the Old/New Events, check to see if anything has changed for the event selected on the Incidents tab.
- On the Notepad tab, view and add notes about the selected run.
- On the Messages tab (MDT only), view sent messages and keep track of them with Done or Undone statuses.
Perform the following tasks in the lower pane:
- View a list of real time view sets.
- Add, remove, and edit real time view sets.
- View real time information, grouped in tabs according to criteria you specify. Sort column rows alphabetically in view sets by double-clicking column headers.