Using the Dashboard
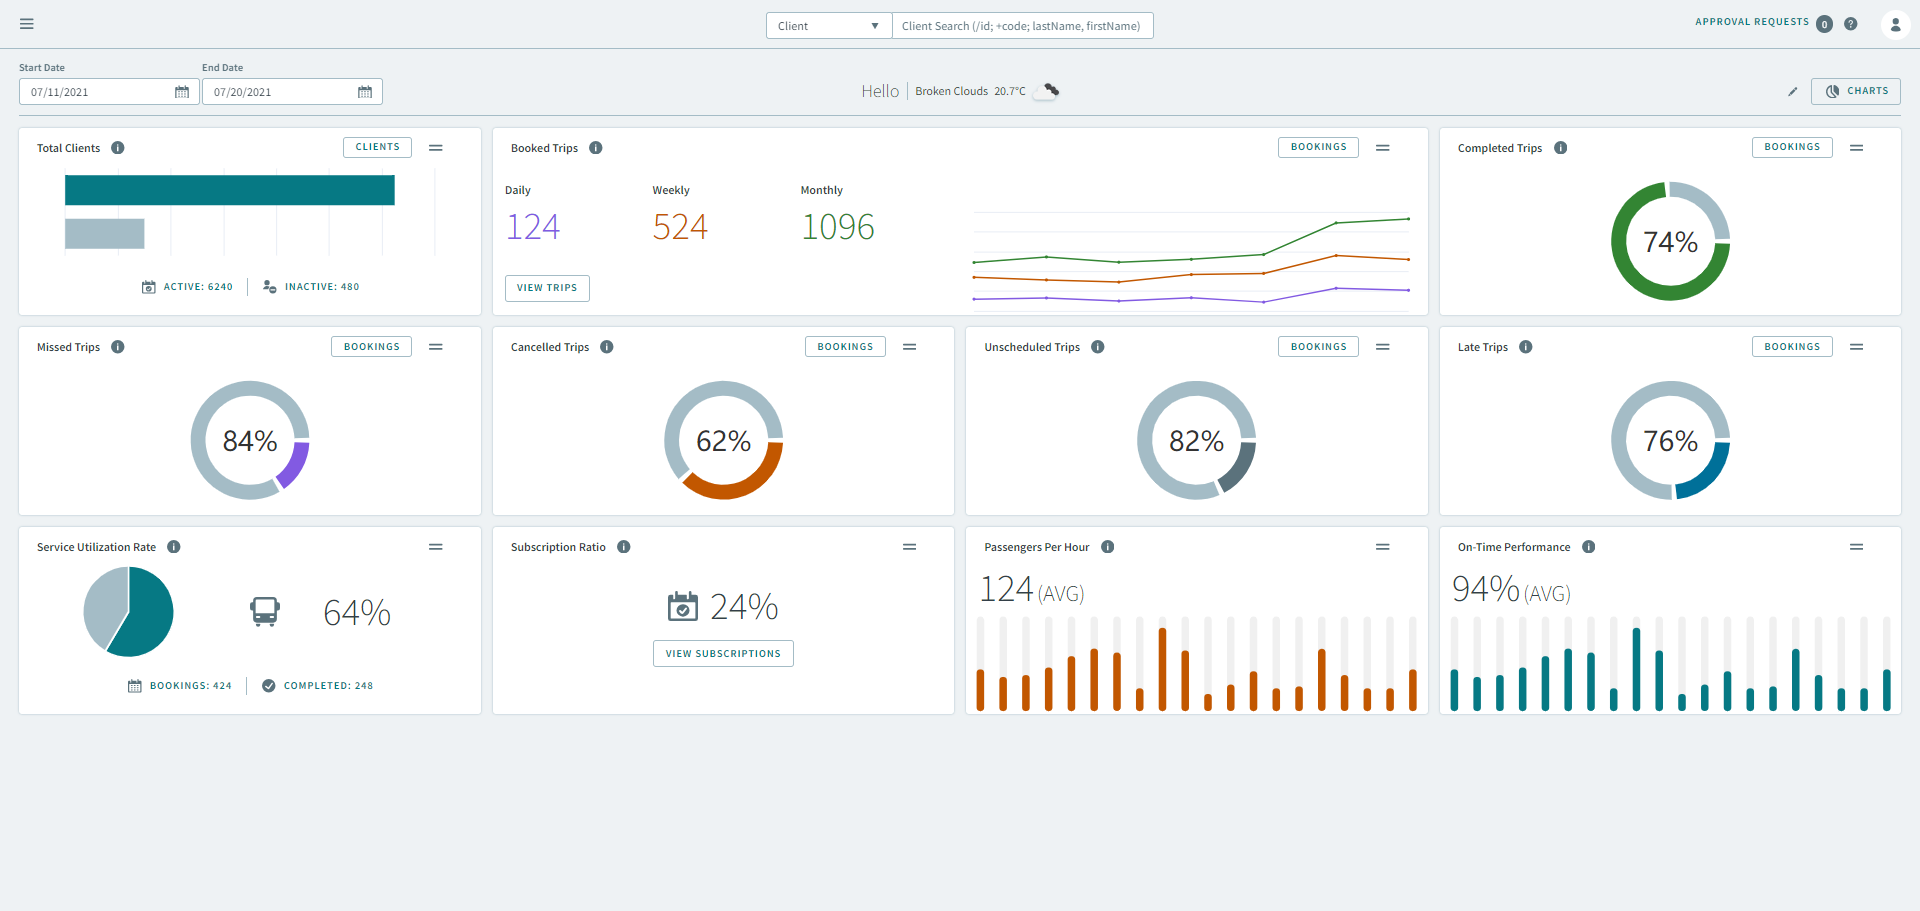
The OneMobility Dashboard is the first page you see after you login. The page provides Key Performance Indicators (KPIs) showing client, scheduling and booking metrics for the day, or for a specifed date range.
How to use the Dashboard page?
The Dashboard page contain metrics used to track client, scheduling and booking information for a specified time frame. The Dashboard uses visual representation to illustrate these metrics such as, graphs, progress meters, counters, bar charts, etc.
The Dashboards can be customize to fit the needs of your transit agency. Speak to your OneMobility impletemeter at the time of system configuration for the types of KPIs you would like to be displayed.
What's on the Dashboard page?
 Graphical charts of the KPIs in OneMobility.
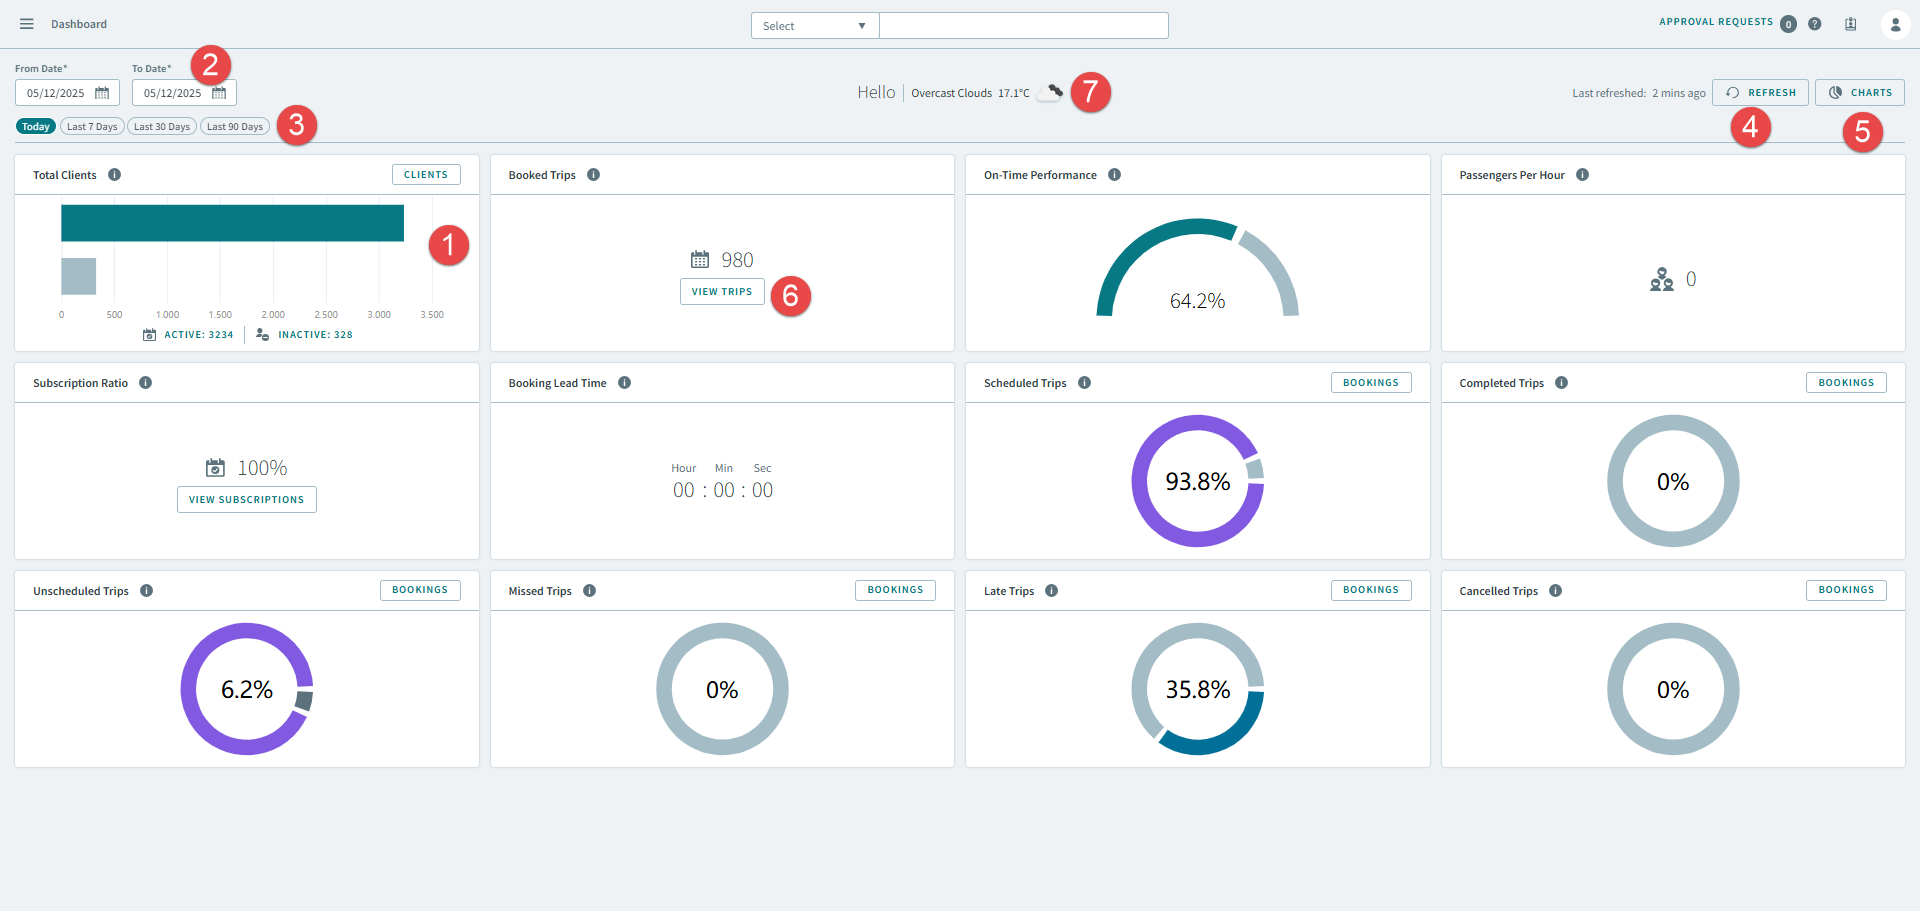
 You can specifiy the date range for the KPIs.
 Selecting a chip filters metrics for the current day, the last 7
days, the last 30 days, or the last 90 days.
Selecting a chip filters metrics for the current day, the last 7
days, the last 30 days, or the last 90 days.  Clicking the Refresh button will check for
and refresh the page with the latest data.
Clicking the Refresh button will check for
and refresh the page with the latest data. Clicking the Chart button opens a pop-up
window that allows you display and hide a KPI chart on the Dashboard.
Clicking the Chart button opens a pop-up
window that allows you display and hide a KPI chart on the Dashboard. Clicking a View button on a KPI widget
displays the data from the widget.
Clicking a View button on a KPI widget
displays the data from the widget.  Displays the temperature of your current location.